
Financial Statement Analysis: A Working Advisor’s Guide
October 21, 2026
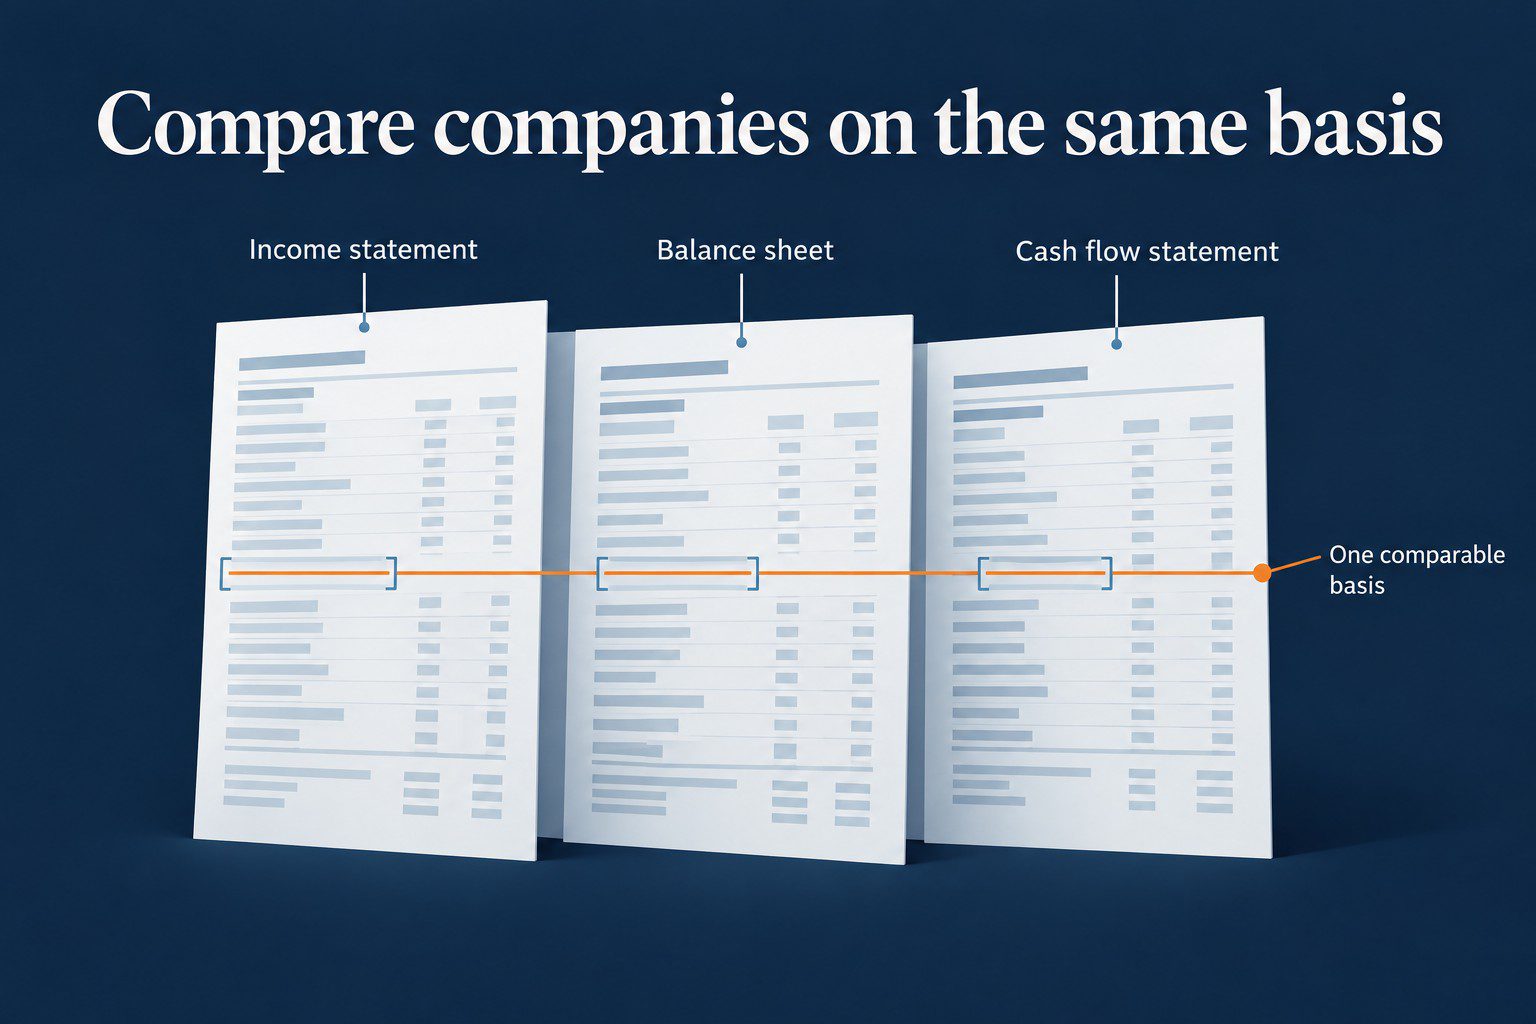
Financial statement analysis checks whether a business earns what its statements say it does. For an advisor, most of the job is comparing one company against another and against its own history. Comparisons only work when the numbers are on the same basis, and as-reported numbers usually aren’t.
This guide covers what each statement tells you, where reported numbers fail, the metric worth anchoring on, and how to turn the work into client conversations.
Key points
- Make the three statements agree on one operating story before you trust any of them.
- Old goodwill, research spending, and one-time charges let similar businesses report different returns.
- Anchor on Uniform ROA against the roughly 12% corporate average, with as-reported ROA beside it.
- A two-sentence explanation built on numbers you can show keeps more clients invested than a chart pack.
What the Three Statements Tell You
Each statement answers a different question, and each can mislead in its own way. The SEC’s guide to reading financial statements covers the mechanics. The table below is the advisor’s version.
| Statement | What It Tells You | What It Can Hide | The Question to Ask |
|---|---|---|---|
| Income statement | Operating profitability for the period | One-time items that recur year after year | How much of this profit repeats? |
| Balance sheet | The asset base behind the returns | Old acquisition goodwill and costs that aren’t economic assets | Does this reflect what the business needs to run? |
| Cash flow statement | Whether operations produce cash | Timing swings in working capital and capex | Does the cash match the operating story? |
The statements are meant to agree on one operating story. When they don’t, that disagreement is the finding, and it tells you where to look next.
We go deeper on what the income statement and balance sheet each tell you and on how to read a cash flow statement in their own articles. This page stays one level up.
Where As-Reported Numbers Fail
Two companies can run the same economics and report different returns. Neither one is lying. Accounting rules are written for auditors and creditors, so they leave room for choices, and the choices move the numbers.
There’s no fraud or restatement in most of these cases. Management teams are just making choices the rules allow, and those choices change the numbers you see in a stock screener.
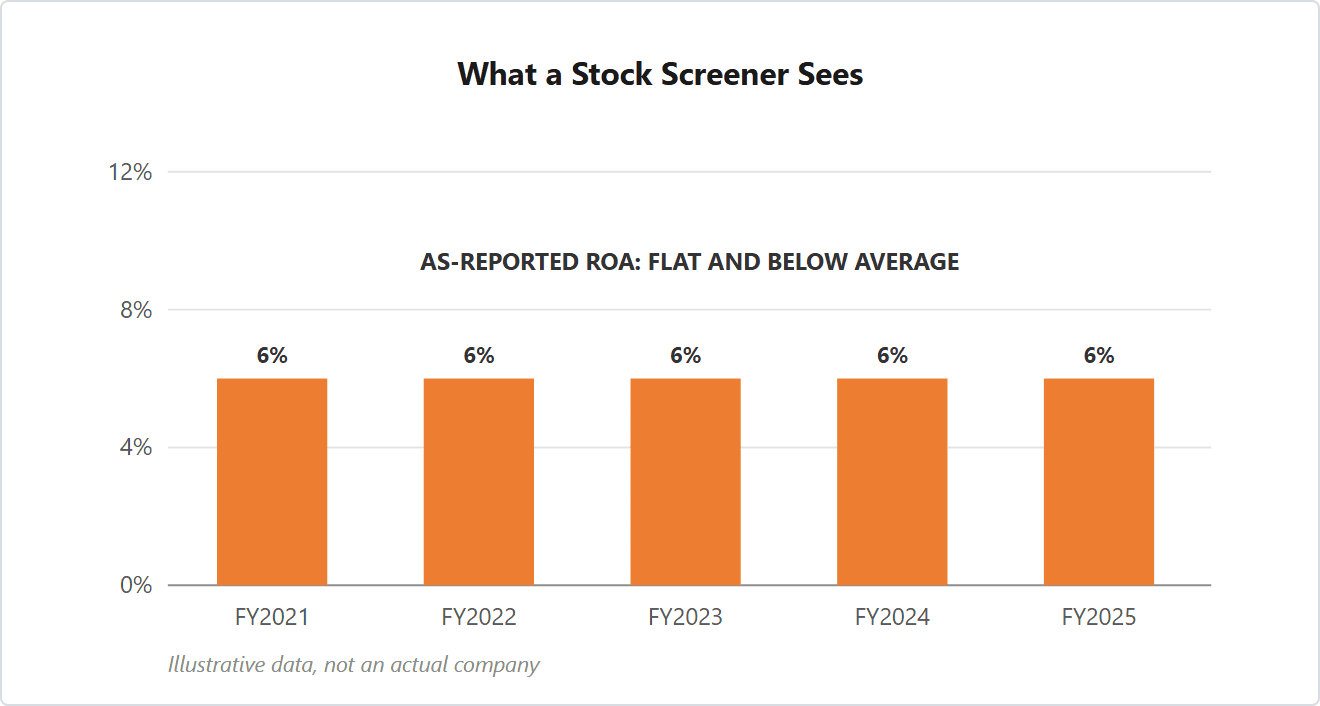
Most of the damage here comes from three choices management teams make. Goodwill from old acquisitions inflates the asset base and depresses measured returns. Operating investments like R&D get treated differently from firm to firm. And one-time charges have a way of coming back every year.
We’ve covered why GAAP earnings can distort profitability in short form, and what forensic accounting reveals when you go into the footnotes. A hub page has a narrower job. Before you trust any ratio, ask what the inputs represent.
Uniform ROA Is the Anchor Metric
Uniform Accounting is Valens Research’s method of adjusting reported financials to one consistent rule set, applying more than 130 adjustments per company. When you put every company on that basis, the comparisons start to mean something.
Use one return metric, and make it Uniform return on assets (“ROA”). The corporate average Uniform ROA runs at about 12%. A company’s Uniform ROA against that average tracked over a few years tells you more than a dashboard of as-reported ratios.
Write both numbers side by side in your notes, as-reported ROA and Uniform ROA, with one sentence on what causes the gap.
Repeatable Steps
You can run the same four steps on any holding.
- Read the three statements and note where they disagree with each other.
- Check the usual distortions, meaning goodwill, operating leases, inconsistent treatment of operating costs, and one-time items that keep recurring.
- Compare Uniform ROA with the company’s own history and with the 12% corporate average.
- Write the two-sentence client explanation. When it won’t write, keep digging.
Those four steps are the whole framework. Everything else in the toolkit, from earnings quality checks to full forensic work, is a deeper version of one of these steps.
Example: The Same Company, Two Pictures
Example Co. reports ROA of 6%, flat for five years. On a screen it looks like a below-average business, and the market prices it like one.
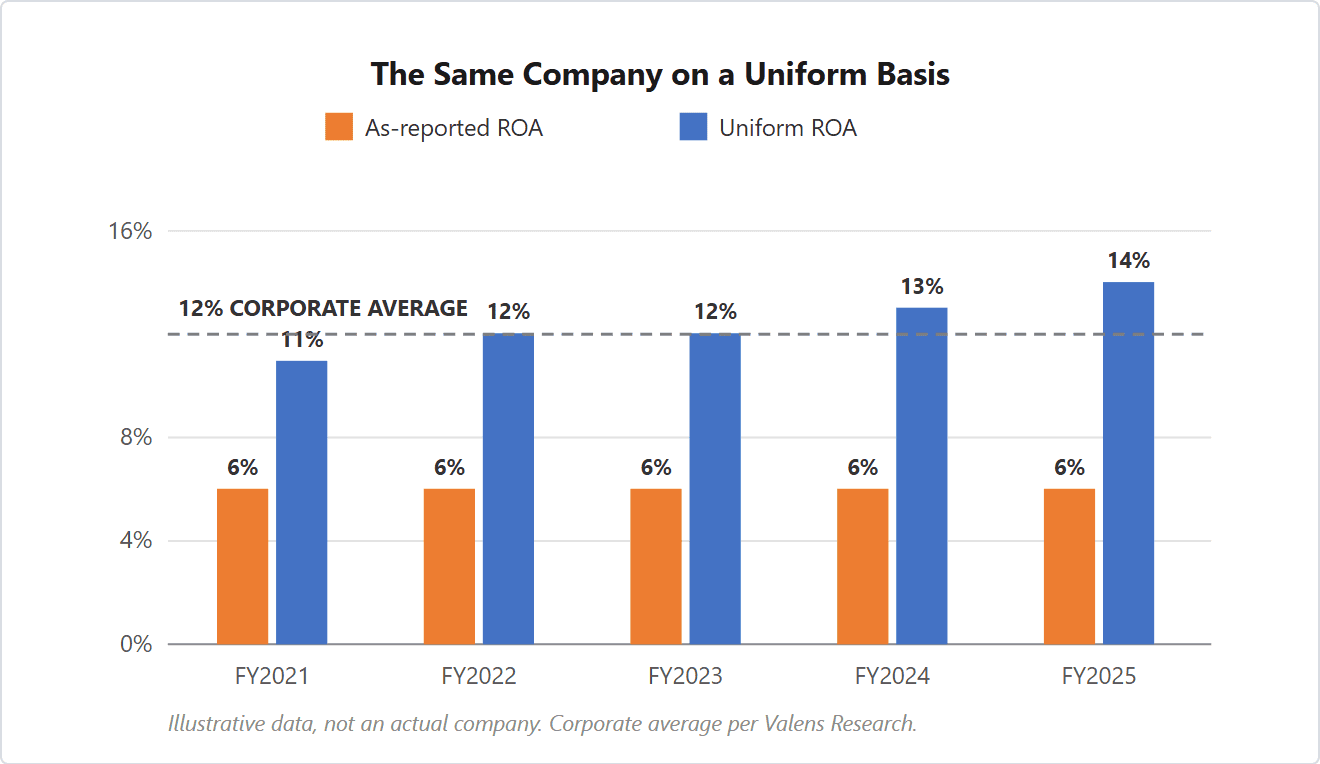
Under Uniform Accounting, two things change. The goodwill from an old acquisition comes out of the asset base, and R&D spending is treated consistently. Uniform ROA comes in at 14% and rising, above the 12% corporate average.
The as-reported view shows a utility. The Uniform view shows a compounding business. Example Co. is an illustrative company, and the numbers are made up, but the gap between those two pictures is the kind of thing this work exists to find.
Turning Analysis Into Client Education
Analysis only builds trust when the client can follow it. A two-sentence explanation, grounded in numbers you can show, keeps more clients invested than any chart pack. That’s also why FA Alpha Academy teaches this framework to advisors as a client-communication skill, along with the analysis itself.
When a Client Reads That a Holding Missed Earnings
“Headlines run on reported earnings. We also track underlying profitability, so we can separate one-time noise from the operating business before we react.”
When a Client Says the P/E Looks Too High
“Accounting choices can pull reported earnings down, and that pushes the P/E up. We judge the business on a comparable basis first, then decide whether the price matches the returns.”
When a Client Asks Why You Trust Your Numbers Over the News
“We’re not arguing with the news. We’re using a consistent measuring stick across every company we look at, so we can compare them fairly and explain each position the same way.”
Key takeaways
- Financial statement analysis checks whether a business earns what its statements say, and comparability comes first.
- Each statement hides something different, so make all three agree on one operating story before trusting any of them.
- One metric, Uniform ROA against the roughly 12% corporate average, beats a dashboard of as-reported ratios.
- An explanation the client can follow in two sentences is part of the analysis, and it’s the part that keeps clients invested.
Frequently asked questions
What is financial statement analysis?
Financial statement analysis is checking whether a business earns what its statements say it earns. For an advisor, it’s mainly a comparability exercise across companies and through time. Standardize the inputs first so your conclusions hold up with a client and a compliance officer.
Which financial statement is most important?
None of them works alone, because each one can mislead in a different way. The income statement can bury recurring one-time noise, the balance sheet can carry legacy accounting that distorts returns, and cash flows swing with timing. You’ll get farther by making all three tie out to the same operating story.
What ratios matter most in financial statement analysis?
You don’t need twenty ratios. Start with as-reported ROA beside Uniform return on assets (“ROA”), then track Uniform ROA against the roughly 12% corporate average that Valens Research cites. Treat other ratios as supporting checks once you trust the inputs.
How do advisors use financial statement analysis with clients?
Advisors use it to explain why a headline number can mislead without implying the company did anything improper. Reported earnings reflect accounting choices, while your process focuses on comparable profitability. If the explanation won’t fit in two or three sentences, tighten the analysis before the call.
One company a day, on a comparable basis
FA Alpha Daily applies this to one company, metric, or market signal every morning, free for financial advisors.