
Income Statement vs. Balance Sheet: What Each One Tells You
August 30, 2026
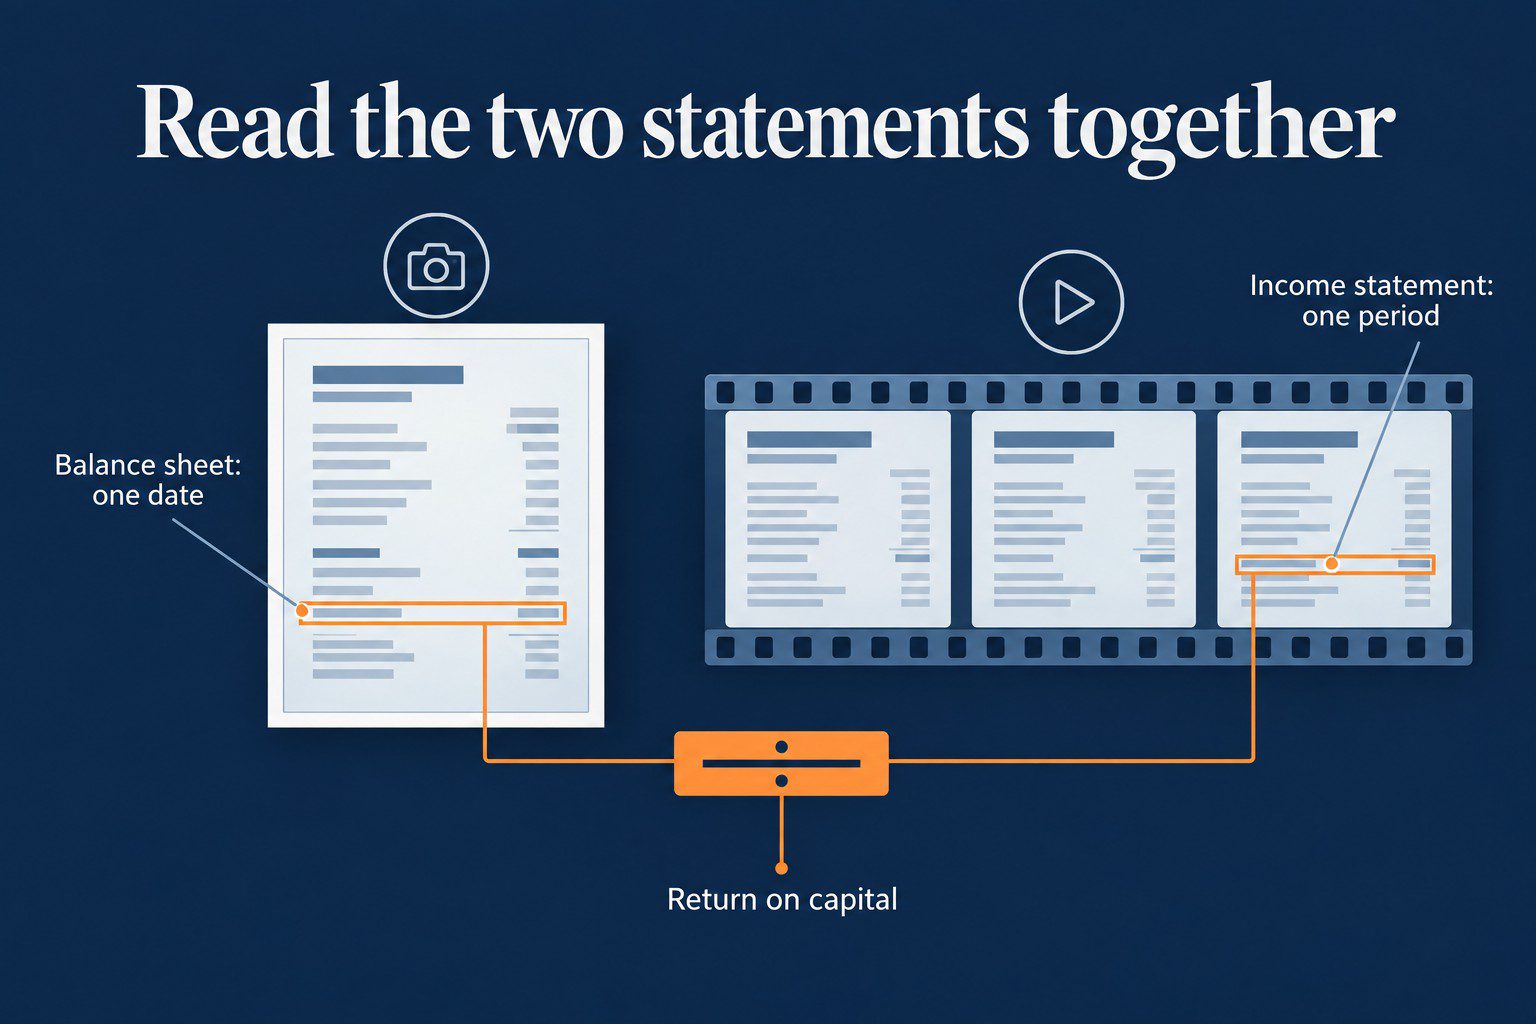
A balance sheet is a photograph. An income statement is a video.
Each one is convincing on its own, and that’s the problem. The income statement can show earnings growth while the balance sheet shows the capital that had to expand to produce it. Read them together and you can answer the one question that matters in a client meeting and a compliance review. Did the business earn an acceptable return on the capital it employed?
Key points
- Net income links the statements through retained earnings, and depreciation links them back.
- Pair an income statement flow with an average capital base to judge return on capital.
- Goodwill, historical cost, and operating leases can make a capital-heavy company look asset-light.
- Ask about return on incremental capital, and skip the invested-capital frame for banks and insurers.
Income Statement vs Balance Sheet, Side by Side
Each statement can sound convincing on its own, and each can tell the wrong story alone. The SEC’s beginners’ guide to financial statements covers what each one contains. The rest of this page is about what each one hides.
| Dimension | Income statement | Balance sheet |
|---|---|---|
| Time frame | Over a period | As of a date |
| Core question | What did the business earn and spend? | What capital does it employ, and how is it funded? |
| Measures | Flows: revenue, expenses, profit | Stocks: assets, liabilities, equity |
| Headline metric | Margin, net income, EPS | Invested capital, debt, book value |
| Household analogy | A year’s pay stubs and spending | A net worth statement |
| Biggest distortion | Timing and repeat “one-time” items | Goodwill, historical cost, off-sheet obligations |
Where the Two Statements Connect
Earnings and debt can rise in the same year. To explain why, you have to connect the two statements.
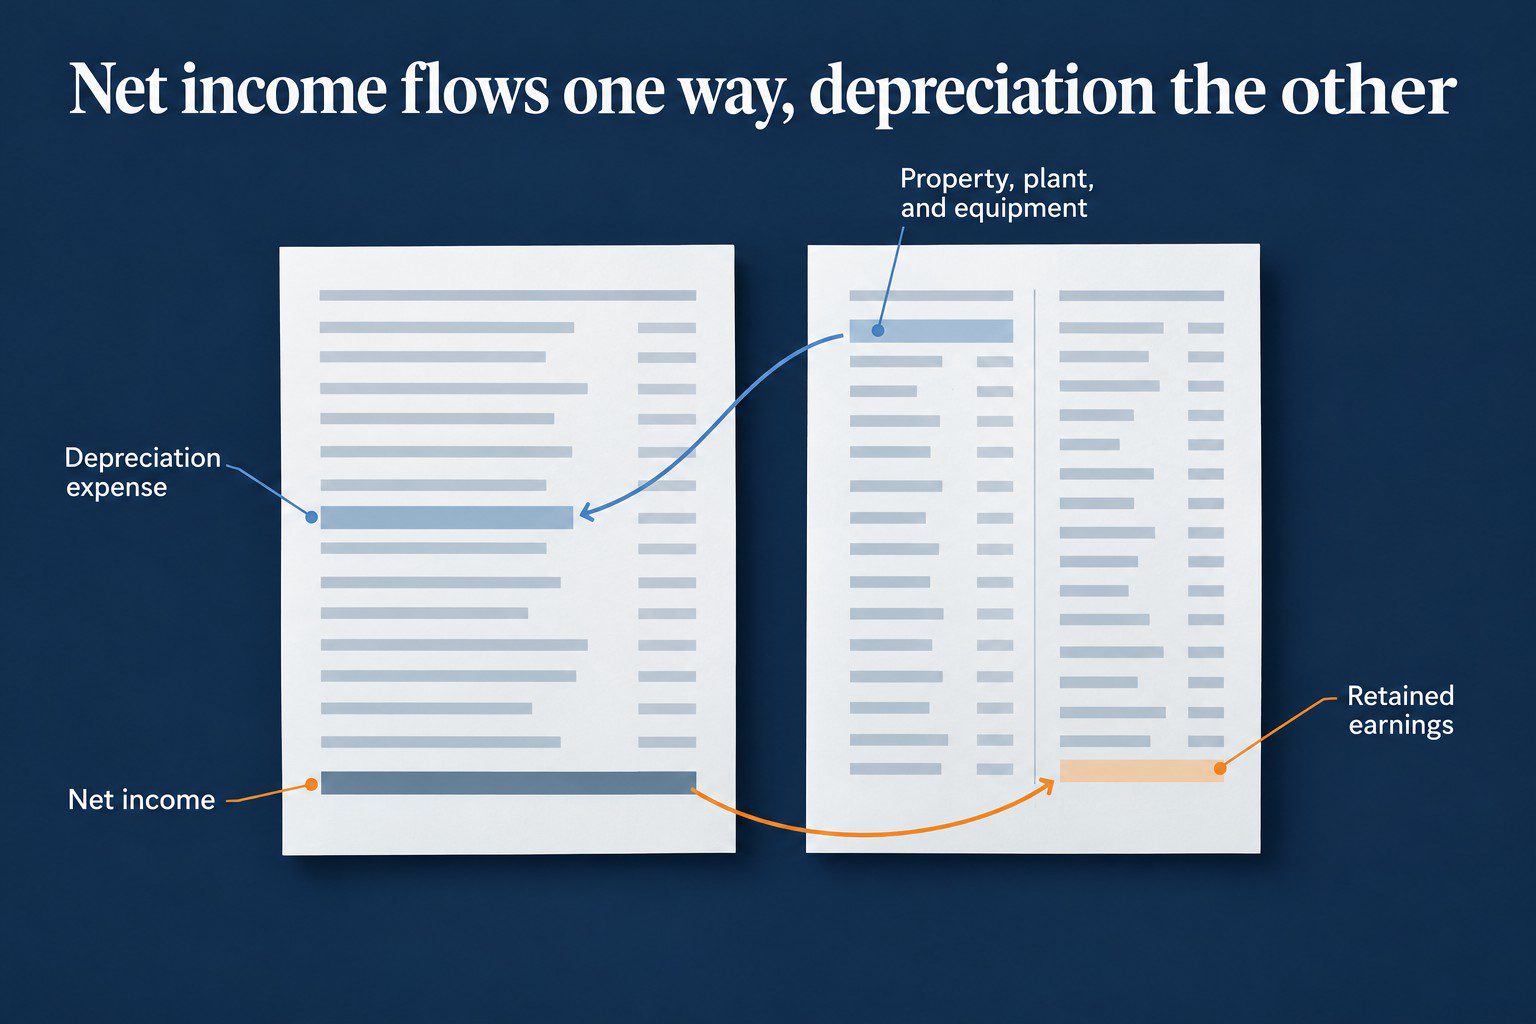
Net income is the hinge. Whatever isn’t paid out as dividends accumulates in retained earnings inside equity. That’s why a company can show rising as-reported earnings while the balance sheet swells. The business kept the profit and reinvested it.
Depreciation is the other bridge, running the opposite direction. The company books the asset on the balance sheet first, then expenses its cost through the income statement over time.
Think of a firm building a new service center or data platform. The spend appears as property, plant, and equipment or capitalized software, and the expense you see later is depreciation or amortization. The timing of that expense is a management choice, which is why a change in depreciation schedules can lift reported profit without changing the business.
When profits are up but cash or debt moved the other way, neither statement alone explains it. The cash flow statement reconciles net income to cash by backing out non-cash charges and explaining working capital and financing changes. Our guide to reading a cash flow statement like a forensic analyst covers that reconciliation.
The Question They Answer Together
Profit growth is half the story. You also need to know whether the business earned that profit on a sensible capital base, or whether it had to pour in more assets, working capital, and acquisitions just to keep growing.
So the question is what return management earned on the capital it employed. Invested capital is the operating asset base required to run the business. Uniform Accounting adjusts and standardizes both earnings and invested capital, so returns can be compared across companies and over time with fewer accounting-driven swings.
In practice, Uniform ROA pairs an income statement flow with a balance sheet stock, usually an average capital base across the period. If you use end-of-period assets against a full year of earnings while the balance sheet is moving fast, you can mistake a business that’s only getting bigger for one that’s getting better.
Example: Profit Up, Returns Down
An earnings chart on its own looks convincing. Put the capital base beside the profit line and the story gets harder to spin.
Example Co. is an illustrative company, and the numbers are made up. Over five years its net income, indexed to 100, runs 100, 112, 121, 130, 140. That reads like a clean 40% earnings gain.
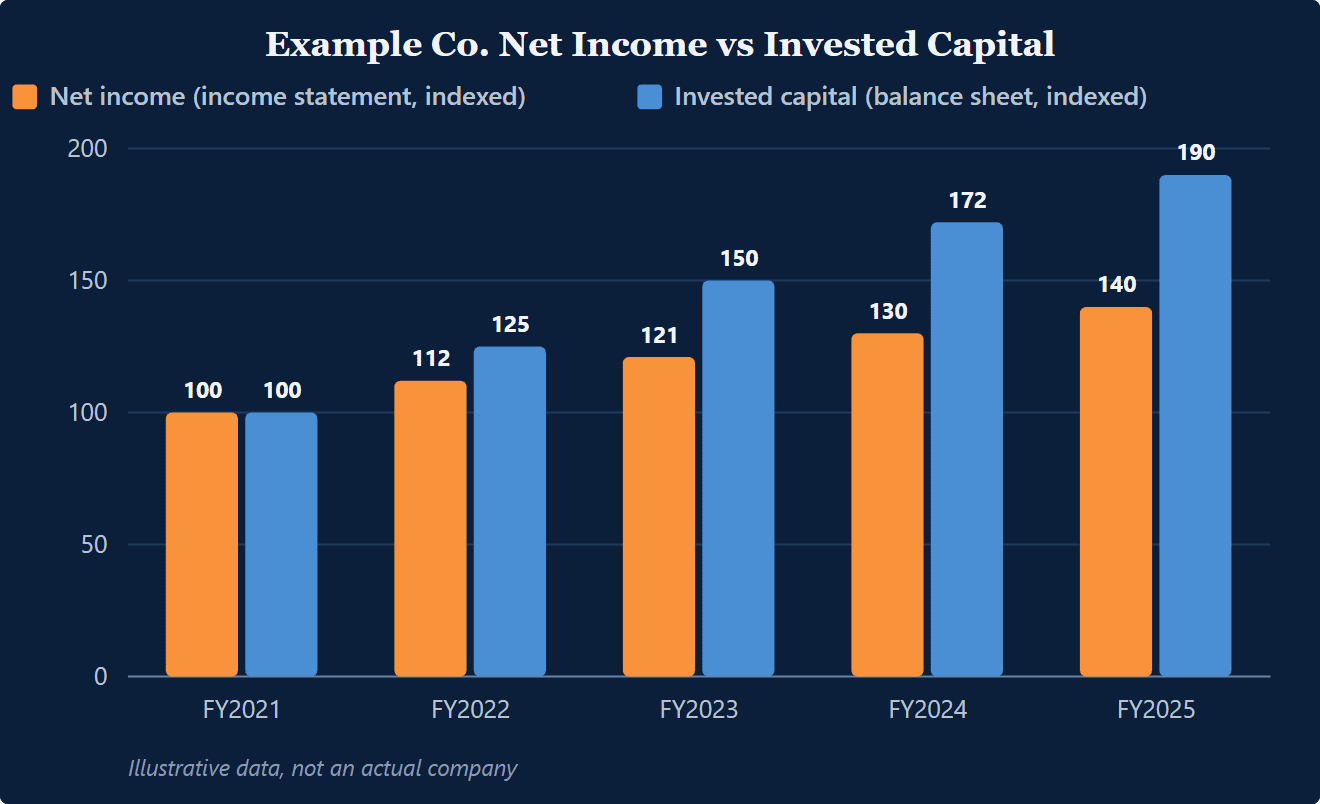
Now put the balance sheet next to it. Invested capital grows 100, 125, 150, 172, 190. Earnings rose 40%, but the capital base rose 90%. Divide one by the other and the return on that capital fell by roughly a quarter over the period, even though the income statement looked better. This is the situation where you’ll cite Uniform ROA, because you’re judging Uniform earnings against a Uniform capital base.
Don’t let growth be the punchline. Track the earnings index and the invested-capital index side by side, and check returns on an average capital base when the balance sheet is moving fast. For how to judge that return, see our piece on return on invested capital.
What the Income Statement Can Hide
Clean margins can still leave you misreading the business. Timing and repeatable “one-time” items keep the score looking steady while the economics slip.
The income statement invites a timing story. Costs get capitalized and appear later as depreciation, or revenue is recognized before the cash settles. Restructuring charges labeled “one-time” return every year, and stock-based compensation never disappears. That’s why you shouldn’t treat as-reported net income as the whole period’s score, and why earnings quality comes before any multiple.
What the Balance Sheet Can Hide
On paper, a company that looks asset-light can require heavy capital. Goodwill, historical cost, and obligations outside reported debt create that gap.
Goodwill hides capital intensity in plain sight. After an acquisition, the asset base gets bigger, but the split between goodwill and operating assets invites a story that the business didn’t need much incremental capital to grow. Historical cost works the same way. Older plant and capitalized software can be carried on the books at values that have little to do with the capacity you rely on today.
Off-balance-sheet obligations complete the picture. Operating leases and similar commitments can fund the operating engine without appearing as debt, so “low leverage” becomes a sloppy conclusion.
Don’t judge capital efficiency from as-reported total assets alone. Ask what has to be capitalized or reclassified for an apples-to-apples view of invested capital, then align it with the Uniform earnings you’re already explaining. A quick tell is store count or headcount scaling up while reported operating assets barely move. Our Knowledge Base page on why GAAP earnings distort profitability lists each adjustment.
Client Conversations
A few lines that tie performance to capital employed will reset the discussion, as long as they stay inside what the filings say.
On record earnings
“Yes, as-reported earnings are up. The question is how much capital it took to get there, because profits that need faster balance-sheet growth can mean lower returns. Did invested capital grow faster than earnings?”
On a loss-making company with six years of cash and no debt
“That balance sheet buys time. It doesn’t buy profitability. Watch whether losses shrink and whether the cash burn lines up with the income statement and working capital.”
On which statement matters
“Both. One is the score for the period, the other is the capital base you needed to post it. Cite only the income statement and you miss the cost of growth.”
Limits and Edge Cases
It helps to know where a returns frame breaks down. Clients hear “the balance sheet grew” and assume you’re calling it bad news.
Balance-sheet growth isn’t automatically a red flag. Building capacity and carrying more working capital to support a larger revenue base can be rational, even when the balance sheet jumps before the income statement catches up. That said, “we invested for growth” can’t end the discussion. Ask about the return on incremental capital. Did the next dollar of invested capital earn an acceptable increase in Uniform earnings, or did the company just get bigger?
Financial companies are the clean exception. For banks and insurers, the balance sheet is closer to the product and debt-like funding is operating in nature. You still read both statements, but you don’t force an operating invested-capital frame onto a model where assets and liabilities behave differently.
Key takeaways
- The income statement measures performance over a period. The balance sheet measures position at a moment. Neither is enough alone.
- Net income links them through retained earnings, and depreciation links them back. The cash flow statement reconciles both.
- Profit growth means little if the capital needed to produce it grew faster. The question is the return on capital employed.
- Each statement carries its own distortions, and Uniform Accounting adjusts both together so returns are comparable.
Frequently Asked Questions
What’s the Difference Between an Income Statement and a Balance Sheet?
The income statement explains performance over a period, while the balance sheet shows the capital base at a point in time. Reading either one in isolation can miss whether the business scaled profits faster or slower than the assets and working capital it required.
How Do You Read a Balance Sheet Quickly?
Start with what the business must keep invested to operate, meaning working capital, plant and equipment, and capitalized intangibles. Then check how it funds that base across liabilities and equity. Then test if the face of the statement understates goodwill-heavy acquisition history, historical-cost asset values, or obligations outside reported debt.
Which Statement Matters More?
Neither gets priority when you’re judging capital efficiency. You need the income statement for the period’s earnings and the balance sheet for the invested capital that produced them. Otherwise you risk praising profit growth that came from an even faster expansion in the capital base.
How Do the Income Statement and Balance Sheet Connect?
Net income that isn’t paid out accumulates in retained earnings, so period performance rolls into equity. Depreciation runs the other direction. Assets go on the balance sheet first, then their cost flows through the income statement over time.
When Is This Returns-Based Approach Less Reliable?
It weakens when the balance sheet doesn’t behave like an operating capital base, especially for banks and insurers. It also gets noisier during major acquisitions or accounting policy shifts, which is why Uniform Accounting pairs Uniform earnings with a Uniform invested-capital view rather than fixing only one side.
One clean read on a company, every morning
FA Alpha Daily applies this to one company, metric, or market signal every morning, free for financial advisors.