
Earnings Quality: How to Tell Real Profits from Accounting Noise
September 1, 2026

Earnings quality is how cash-backed and repeatable a company’s reported profit is. You use it to decide if the “E” in P/E is usable. Low earnings quality can inflate or depress earnings without breaking any rules.
That makes the “E” a valuation input that can be wrong in either direction. Tie earnings back to cash from operations and working capital, then set the as-reported results beside the Uniform view. The difference between the two is one you can explain to a client and to a compliance officer.
Earnings Quality Changes Valuation
A well-built model prices the business wrong when it puts more weight on an earnings number than on operating cash flow. P/E only works when the “E” holds up. When earnings quality is low, adding a risk premium isn’t enough, because the model has the wrong input.
Accrual-driven net income is earnings that run ahead of cash. If as-reported net income rises on accruals or on a gain that won’t repeat, the stock can screen cheap on a low P/E while the underlying earning power stays where it was. A one-time asset sale can lift the denominator for a year. Then you’re defending a low multiple that disappears once you price the company on cash and recurring margins.
R&D expensing and acquisition accounting push in the other direction. GAAP rules hold down as-reported earnings at investment-heavy companies, so those companies look expensive. A screen built on as-reported P/E never finds them, and you can pass on a business with strong unit economics because its earnings measure doesn’t match its economics.
So run every P/E comparison as a two-step check. Compare the as-reported P/E to the Uniform P/E, then ask what caused the difference. If you can’t explain why the denominators differ, you’re valuing the accounting instead of the business.
Four Properties, Five Mistakes
Two peer companies’ 10-Ks can tell two different profit stories with no fraud and no restatement. Each company made choices GAAP allows, and those choices change what the income statement shows. They also change what you think you’re paying for.

High-quality earnings pass four tests. They’re cash-backed, repeatable, conservatively measured, and comparable to peers. Most earnings-quality problems trace back to five mistakes. Each one fails at least one of the four tests, and each has a simple check you can run before you lean on a P/E or a margin trend.
- Timing (profit before cash): Earnings look cash-backed until working capital and other accruals start supplying the growth. Check if cash from operations tracks net income over several quarters. Our guide to reading a cash flow statement covers the mechanics.
- Capitalizing vs. expensing: Earnings look more repeatable than they are when costs get parked on the balance sheet. They look less comparable when peers capitalize what this company expenses. Check for shifts in capitalization policy and for capitalized assets that grow faster than revenue.
- Recurring “one-time” items: Excluding a charge once is conservative. When “once” becomes a pattern, the earnings stop being repeatable. Check how often restructuring or impairment lines appear across the cycle.
- Acquisition accounting: Goodwill inflates the asset base and depresses return ratios. Later impairments swing reported profit without changing the business. Check if deal activity and amortization explain the gap between as-reported and underlying results.
- Off-balance-sheet obligations: Earnings can look comparable while the economics aren’t. Other commitments stay in the footnotes, and lease costs run through operating expense, where Uniform Accounting counts them as depreciation and interest. Check for obligations that act like financing and ask if reported profitability ignores them.
The discipline of finding these is forensic accounting. You don’t need the credential, only the checklist.
Two Ratios That Measure the Gap
Research going back to Sloan’s 1996 accruals study finds that the accrual part of earnings persists less than the cash-flow part. Two quick ratios keep you from underwriting a number that won’t last.
Work from the cash flow statement back to net income. Cash conversion is cash from operations divided by net income.
Cash conversion = Cash from operations ÷ Net income
When cash conversion stays below roughly 0.8 (an illustrative threshold), you need an explanation that ties to the business model rather than to the earnings-call script. A company can post “record EPS” while receivables pull cash out of the business. You’d still have to justify why that earnings base deserves its multiple.
Then quantify the accrual load.
Accrual ratio = (Net income − Cash from operations) ÷ Average total assets
A rising accrual ratio means a larger share of earnings came from non-cash accounting entries. Those entries persist less reliably than the cash component.
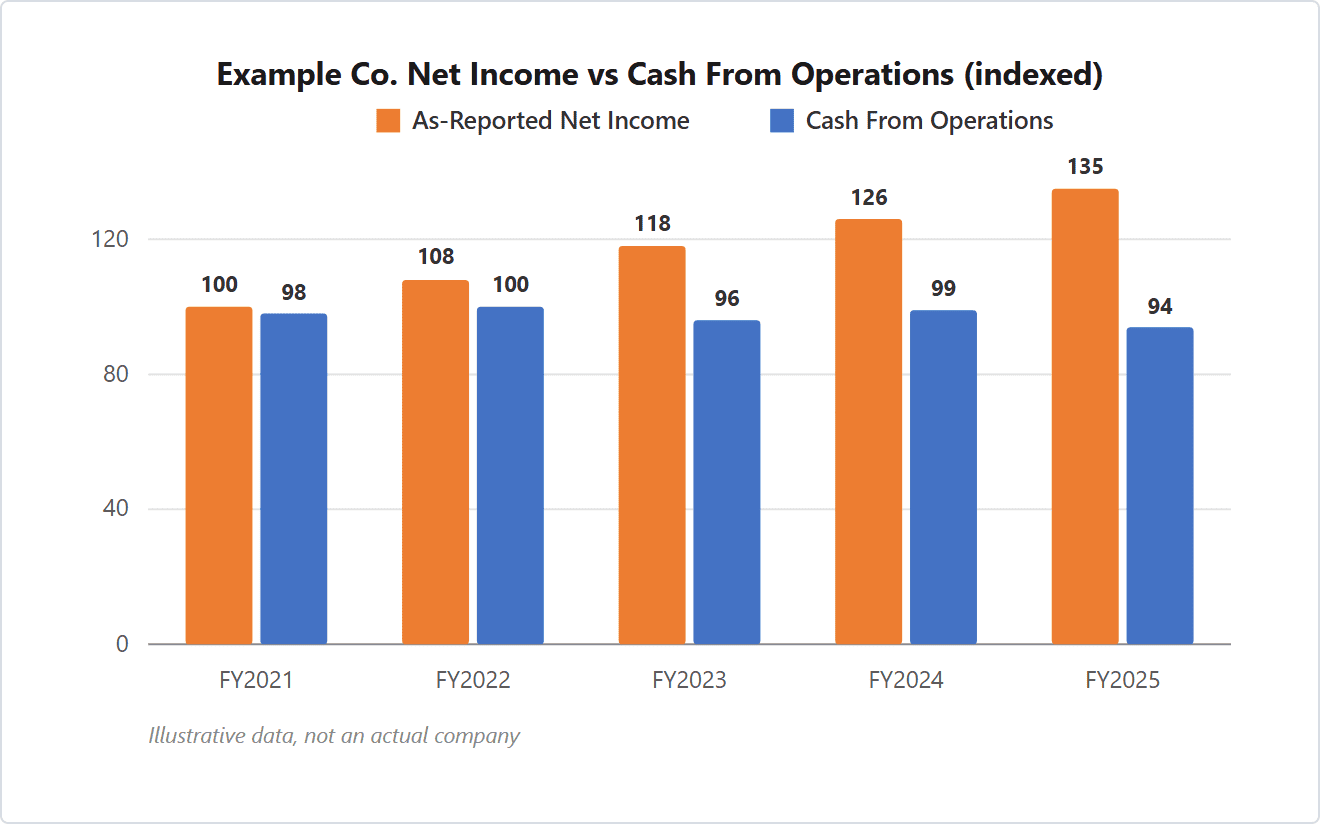
Example Co. is an illustrative company, and the numbers are made up. Its net income climbs 35% over five years while cash from operations goes nowhere, so cash conversion slides from 0.98 to 0.70. Both ratios are built to catch that picture.
Run both ratios over several years, then pin any movement to a specific cause. If cash conversion weakens while the accrual ratio rises, don’t write it off as working capital timing and move on. Go to the cash flow reconciliation in the 10-K. What changed in receivables or payables, and is that change now part of the earnings you’re underwriting?
Five Checks You Can Run Fast
You can test earnings quality without building a full model. A 10-K and 10-Q checklist tells you if the “E” in your multiple is cash-backed and repeatable.
| Check | Where to look | Red flag |
|---|---|---|
| Receivables vs. sales | Balance sheet (receivables), income statement (revenue), cash flow (CFO) | Receivables grow faster than revenue while CFO lags net income |
| Recurring “one-time” items | Footnotes, MD&A, restructuring and impairment lines | “Non-recurring” charges or gains appear every year |
| Non-GAAP vs. GAAP gap | Earnings release reconciliation, non-GAAP discussion in the 10-K | Add-backs get bigger as the business improves |
| Accounting policy changes | Summary of significant accounting policies, against last year’s | Longer useful lives or looser capitalization lift earnings |
| Payouts vs. free cash flow | Cash flow statement, financing section | Buybacks and dividends run ahead of free cash flow, funded by debt |
Run these across several years rather than one quarter. When a flag fires, write down what changed and why, so you can defend the earnings story you’re underwriting.
Example: Noise Versus Business
One chart shows the difference between defending a one-off accounting event and underwriting a repeatable earnings line.
Example Co. is the same illustrative company. Its as-reported earnings, indexed to 100, run 100, 70, 130, 95, and 140 over fiscal 2021 to 2025. The 2022 drop is an impairment, and the 2023 spike is an asset-sale gain. Neither item means the core business shrank and then grew.
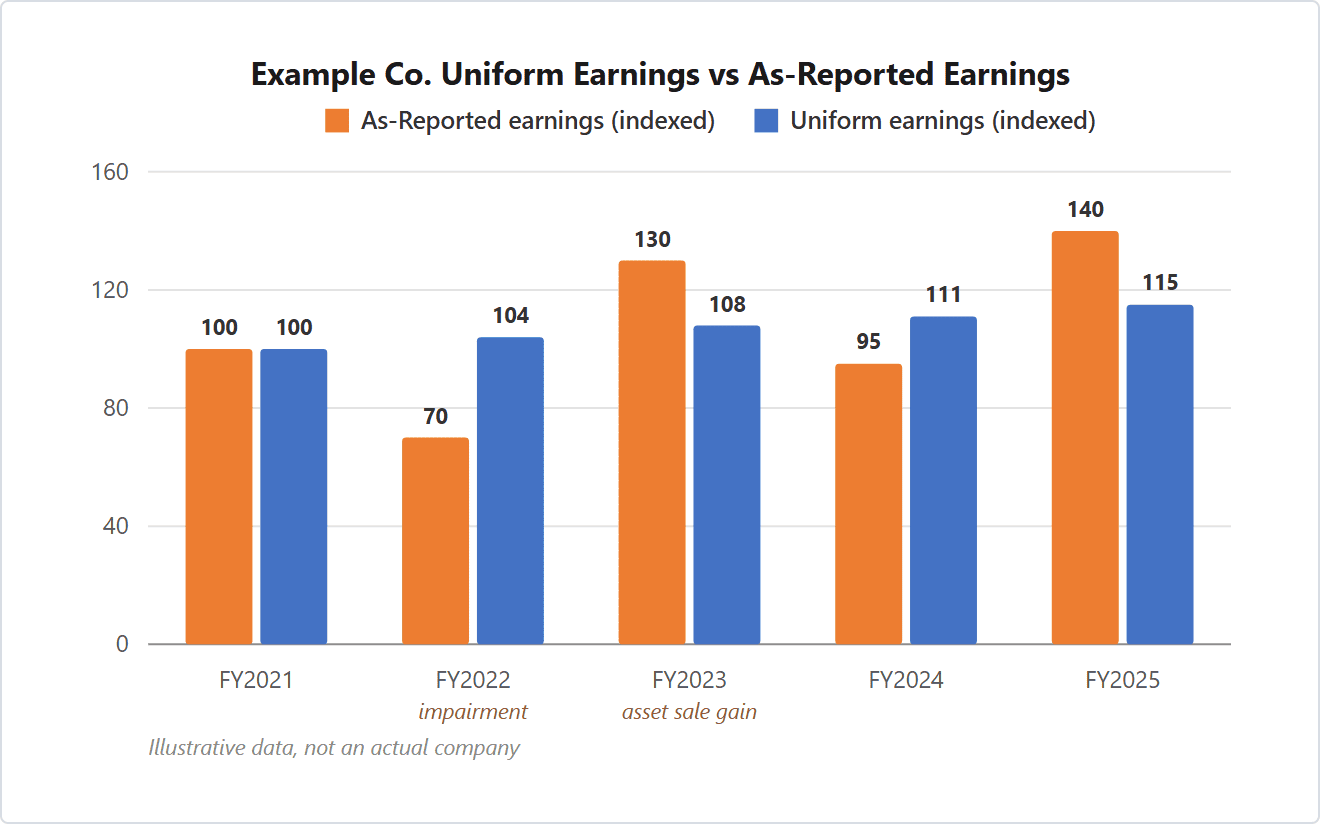
Now set that beside the Uniform view. Uniform Accounting is a normalization method that adjusts reported financials for comparability, with judgment calls of its own. Under Uniform Accounting, Example Co.’s earnings run 100, 104, 108, 111, 115. The underlying line reads like a steady 3% to 4% grower.
A valuation or a Uniform P/E comparison anchored to the as-reported path defends accounting events as if they were operating results.
Three Client-Ready Explanations
Clients don’t want an accounting debate. They want to know why you watch underlying earnings and cash when the headlines celebrate EPS.
For an earnings beat that missed on cash
“They beat on EPS, but the cash hasn’t arrived yet. Cash conversion fell because working capital moved against them. Until collections normalize, I’m treating this as a timing question rather than a step up in earning power.”
For a holding whose reported profit looks low because it expenses record R&D
“This business is investing heavily, and GAAP takes most of that cost up front. The reported margin looks weaker than peers that buy their growth. I’m watching the Uniform earnings trend instead of this year’s as-reported EPS.”
For a name you passed on whose earnings grew 40% while cash from operations stayed flat
“The growth wasn’t cash-backed. When net income rises and cash from operations doesn’t, the gap is usually accruals or recurring add-backs. I’d rather wait for the cash to confirm the story than pay a multiple on numbers that may not persist.”
The same logic runs the other way when you’re hunting for undervalued stocks. A hidden-quality company reports earnings that understate its business. That is the screen behind the FA Alpha 50, a monthly list of 50 companies that pass on Uniform Accounting numbers.
Where It’s Less Reliable
Capital-intensive companies and fast growers can show low cash conversion for legitimate reasons in a given year, especially when working capital ramps. Banks and insurers need different measures than CFO-based ratios. Every normalization method, Uniform Accounting included, embeds judgment about useful lives and capitalization. Our Knowledge Base page on why GAAP earnings distort profitability walks through each adjustment and its assumptions.
Key takeaways
- Earnings quality is how cash-backed, repeatable, conservatively measured, and comparable reported profit is, and it decides if the “E” in P/E is usable.
- Five permitted GAAP choices do most of the damage: timing, capitalizing versus expensing, recurring “one-time” items, acquisition accounting, and off-balance-sheet obligations.
- Cash conversion and the accrual ratio measure the gap, and five filing checks locate the cause.
- Low quality cuts both ways: inflated earnings make a weak business look cheap, and depressed earnings make a strong one look expensive.
Frequently Asked Questions
What Is Earnings Quality?
Earnings quality is how cash-backed, repeatable, conservatively measured, and comparable reported profit is. You use it to judge if the “E” in P/E reflects the business or the accounting choices behind it.
What Is the Quality of Earnings Ratio?
Advisors usually mean cash conversion, which is cash from operations divided by net income. It’s useful, but read it over several years, because working capital and growth can distort a single period.
What Is the Accrual Ratio, and Why Does It Matter?
The accrual ratio is net income minus cash from operations, divided by average total assets. When it rises, more of the earnings came from accruals rather than cash, and research finds the accrual component persists less reliably than the cash component.
How Should You Treat Company-Reported Non-GAAP Earnings?
Start with the reconciliation and ask if the same exclusions recur every year. The SEC’s guidance on non-GAAP measures frames what issuers can present and how they must reconcile it. If the add-backs grow as the business improves, you’re looking at a redefined earnings number rather than a cleaner view of operations.
When Are Earnings-Quality Methods Less Reliable?
Capital-intensive companies and fast growers can show low cash conversion for legitimate reasons in a given year. Banks and insurers need different measures than CFO-based ratios. Any normalization method, including Uniform Accounting, embeds judgment calls about useful lives and capitalization.
One earnings-quality check, every morning
FA Alpha Daily applies this check to one company, metric, or market signal every morning, free for financial advisors.