
How to Find Undervalued Stocks and Skip Value Traps
August 28, 2026
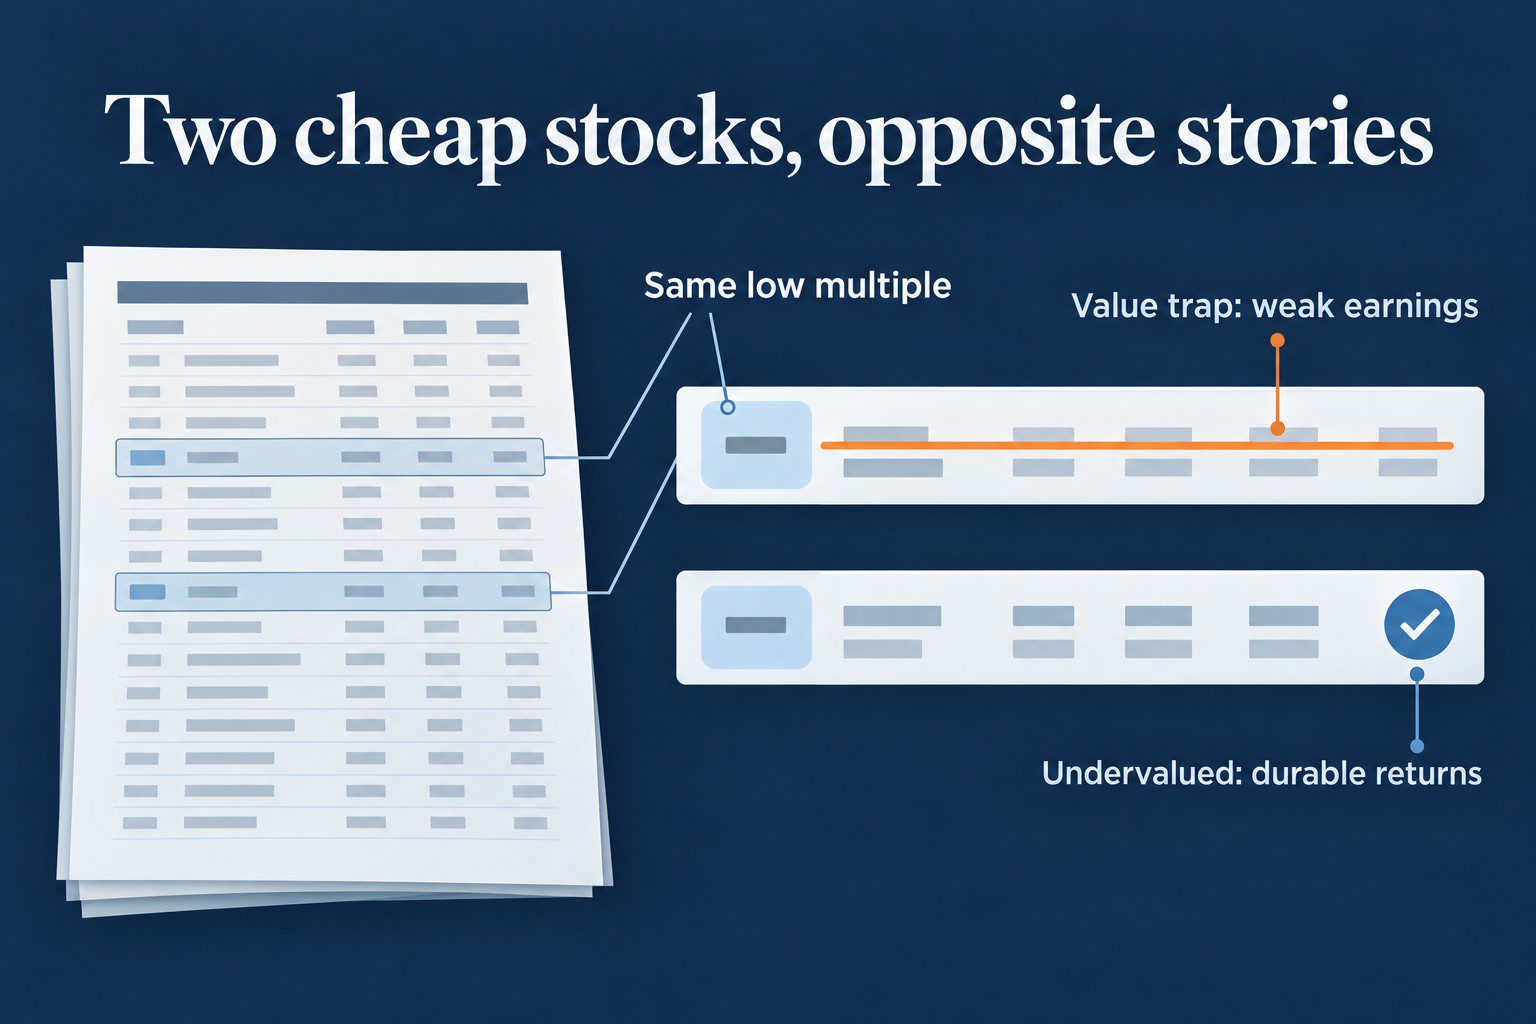
An undervalued stock is priced for weaker performance than the business has delivered. There’s a simple way to find one. Clean up the numbers, then compare what the business earns against what the price assumes.
Most analysts start with a low P/E and a low price-to-book. That’s the biggest mistake in the search for undervalued stocks. That screen gives you purchase-accounting effects and non-cash items you’ll have to explain to a client and a compliance officer. The workflow below runs the other way. Adjust the as-reported financials with Uniform Accounting, a standardized set of adjustments that makes companies comparable, then screen for durable Uniform return on assets (“ROA”) and cash conversion. Only then ask if the price is wrong.
Key points
- Low P/E and low price-to-book screens pull in goodwill-heavy acquirers and debt-funded payouts.
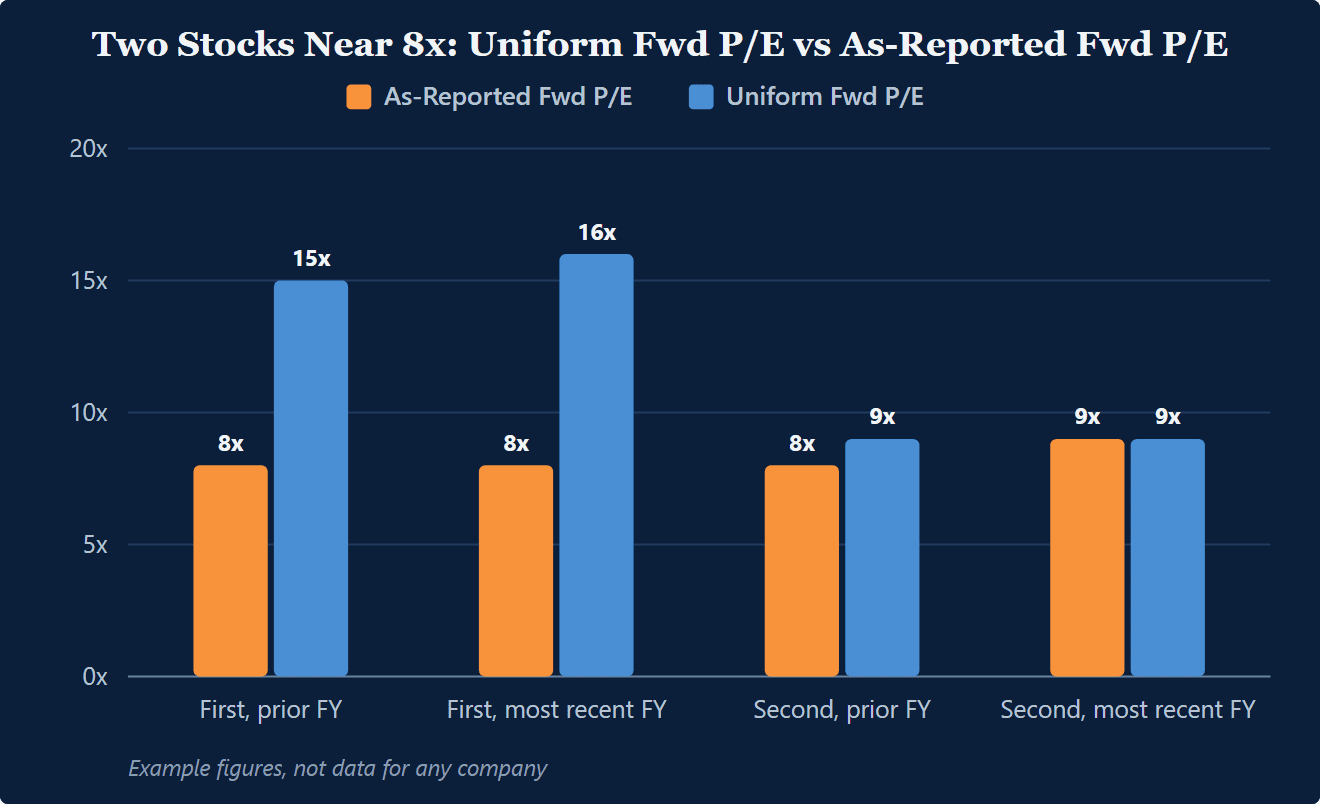
- Two drugmakers (example figures) both screen at 8x as-reported, but Uniform P/E puts them at 15x and 9x.
- Screen for Uniform ROA above the 12% average for five years and cash conversion near 1.0.
- Uniform ROA sliding toward the cost of capital and payouts bridged by debt signal a value trap.
Why Cheap Screens Find Value Traps
A cheap screen rewards whatever makes as-reported earnings look high today. That bias pulls you toward companies with capitalized costs and “one-time” gains that keep recurring. You can tell yourself you’re buying a discount, but you’re often buying the noisiest accounting.
A low-P/E, low-price-to-book sort fills your inbox with acquisition-heavy firms whose goodwill and intangibles muddy the asset base. It also serves up “cheap yield” companies that fund payouts with rising leverage. In an investment committee, those are the holdings that leave you explaining why the multiple means anything.
The screen also misses the other side. A business that expenses heavy R&D or carries goodwill from a good acquisition can look expensive on reported numbers while earning well above average on its capital. A conventional stock screener never finds it.
Treat a cheap screen as a triage list, not a buy list. Clean the numbers, then test if returns held through the cycle, before you trust the headline valuation.
What You Have to Clean First
When a cheap stock turns out not to be, the reason is usually an adjustment you didn’t make. Cleaning comes first because as-reported numbers mix economics with accounting choices. The cleaning separates what happened to earnings from what happened to the asset base.
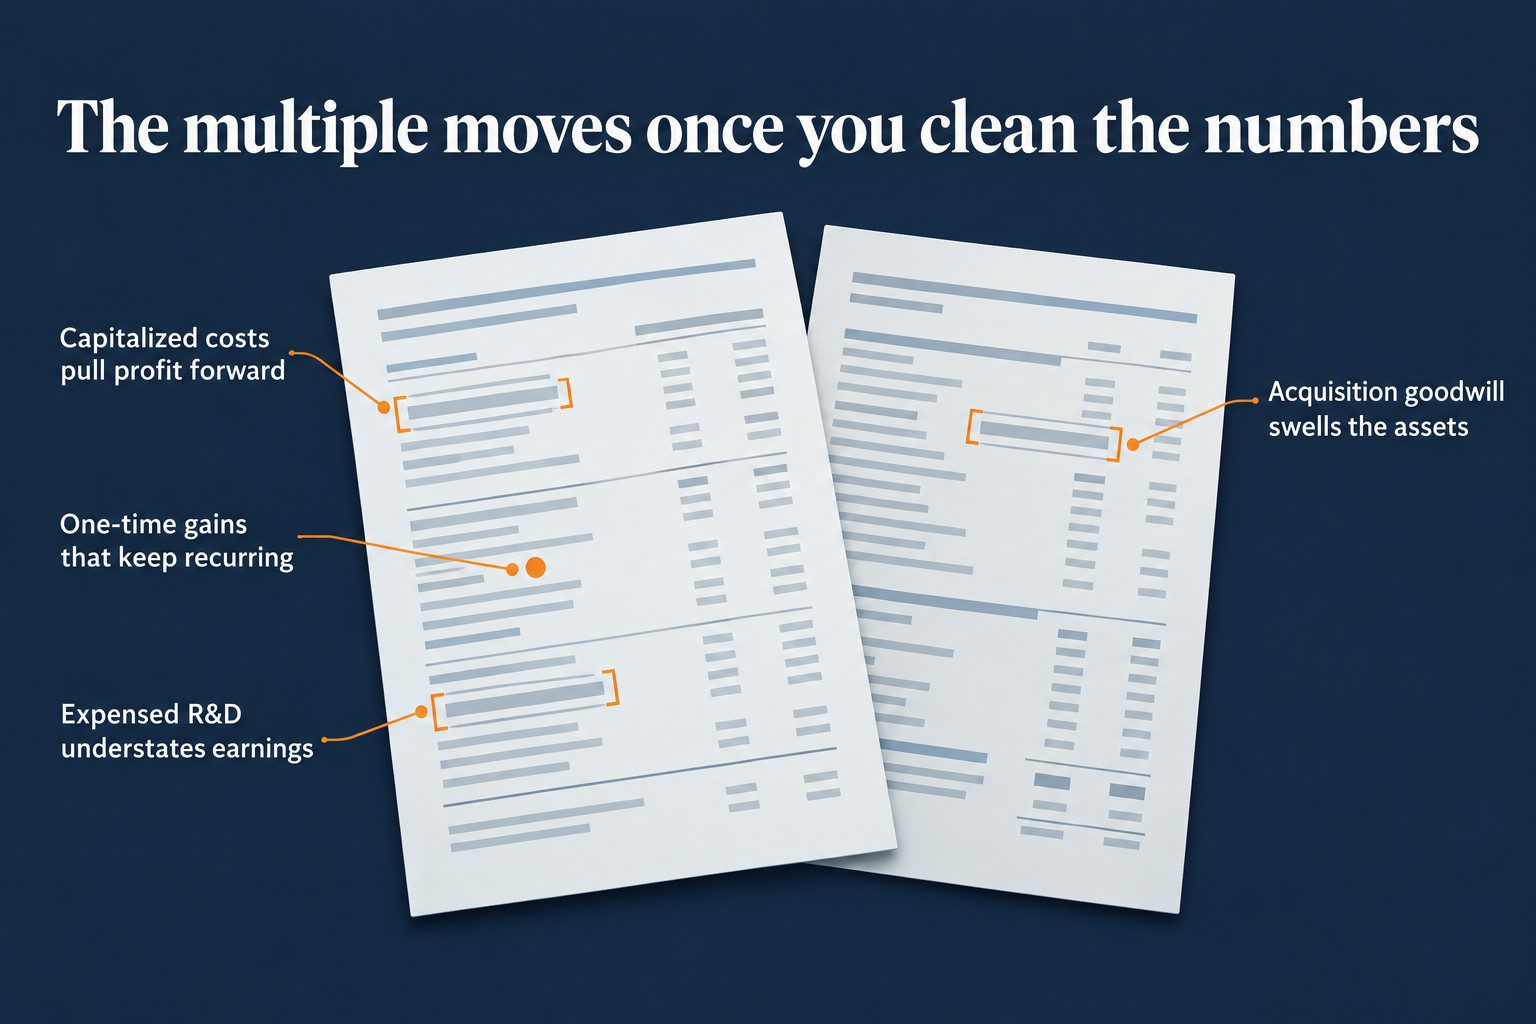
On the earnings side, capitalized costs and recurring “one-time” gains pull profit forward, so a stock looks cheaper than it is. Expensed R&D pushes the other way, so an investment-heavy business looks more expensive than it is. On the asset side, goodwill from acquisitions swells reported assets and mechanically dilutes as-reported ROA even when the operating engine hasn’t changed.
The guides to earnings quality and forensic accounting cover the checks. Without the cleaning, you’re quoting a multiple that never matched the business.
Example: Same P/E, Opposite Truth
Two stocks can both trade at about 8 times as-reported forward earnings and mean opposite things. If you treat that 8x as the price of the business, you’re measuring against the wrong denominator.
Take two drugmakers from the same pharmaceutical industry, so the comparison is like for like. The figures below are example figures and describe no actual company. In the prior fiscal year, both traded at 8x as-reported forward earnings, so a cheap screen ranks them side by side. On Uniform earnings, the first traded at 15x, nearly twice what the screen showed. The second traded at 9x, about where it screened. The most recent fiscal year reads the same way, 8x as-reported against 16x Uniform for the first drugmaker and 9x against 9x for the second. The same reported multiple flattered one company and told the truth about the other.
Now test durability. On the same example figures, the first drugmaker’s Uniform ROA was 5% in both fiscal years, and its as-reported ROA was 6% in both. At the second, Uniform ROA was 22% in the prior fiscal year and 18% in the most recent, against as-reported ROA of 7% and 9%. Both sit against an illustrative 8% cost of capital, the return investors require for the risk they’re taking. Industry averages run from the mid single digits to the low teens. Two fiscal years can’t settle durability on their own, and the longer series is the next thing to pull. What these two years show is the level. One company earned below that threshold in both years, and the other earned well above it in both.
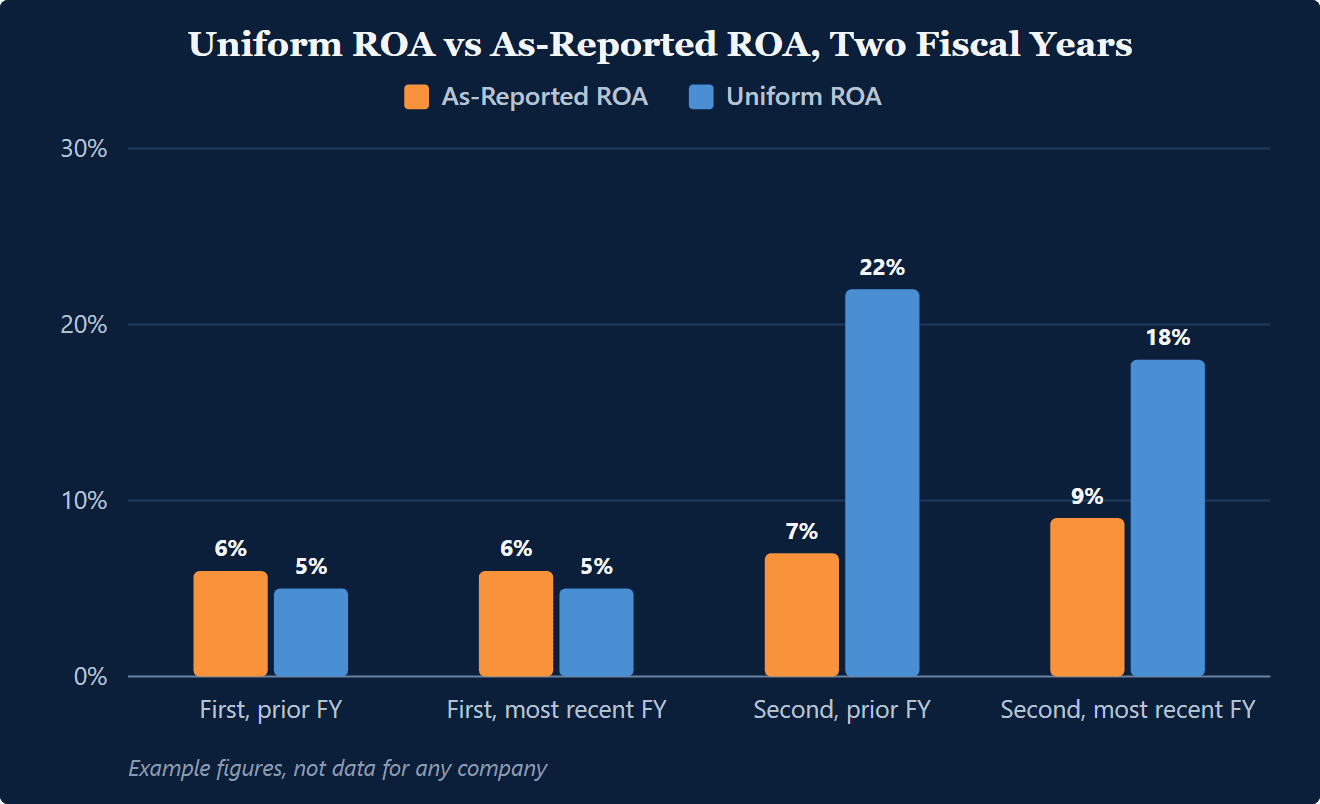
On these figures, the first drugmaker has the shape of the value trap. The low reported multiple is no bargain for a business whose Uniform returns are below an illustrative 8% cost of capital. The as-reported earnings hide that the Uniform multiple is nearly twice as high. The second has the shape of the undervalued setup, with Uniform returns well above that threshold, a price near 9x Uniform earnings, and as-reported returns that understate the business. A longer series answers the durability question for both. Once you lay the two side by side, you stop asking “is 8x cheap” and start asking what the price already assumes about durability.
The Five-Step Process for Undervalued Stocks
An advisor team can agree on process faster than on tickers. A repeatable sequence keeps the debate on inputs rather than headlines, and you can document it for compliance.
1. Clean the Numbers Before You Screen
Adjust the financials so your inputs match the business. Stop treating as-reported earnings as a stable denominator. Every later step runs on these numbers.
2. Screen for Quality First, Price Second
Make Uniform ROA the gate. Uniform ROA measures Uniform operating earnings over Uniform operating assets on a consistent basis, so it gives you a durability check you can explain. Keep the screen simple:
- Uniform ROA above the 12% corporate average for five years or more.
- Cash conversion near or above 1.0, defined as cash from operations divided by net income.
- Evidence that incremental capital still earns an acceptable return, rather than reported earnings growing.
In a portfolio meeting, don’t let a 6% dividend yield distract the committee if cash conversion is 0.6 and the company keeps bridging the payout with working-capital releases.
3. Find Where the Price Assumes Too Little
Now test valuation as an expectations question. A 9x Uniform P/E on a business earning 16% on its capital implies the market expects returns to fall toward the average. The record says they haven’t. That’s a specific mismatch you can underwrite. The same test runs in reverse to tell if a stock is overvalued.
4. Ask Why It’s Cheap, and Whether That’s Temporary or Structural
Every genuinely undervalued stock is cheap for a reason, and you need that reason in writing. Many advisors skip this step because they want the screen to do the thinking. Read the last two earnings calls for management’s explanation, and check if their confidence matches their numbers. Then map the debt maturity schedule. A cheap stock with a refinancing due in a tight credit market can get much cheaper.
5. Demand a Margin of Safety, Then Wait
Set entry and trim bands that keep you out of the right-thesis, wrong-price problem. You don’t need perfection, but you need a buffer between what the price implies and what the business has delivered. Pre-define what has to stay true for the holding to stay on the approved list, usually a Uniform ROA range and cash conversion behavior. Then you can wait without improvising a new story each quarter.
Value Trap Signals Versus Genuine Undervaluation
| Check | Value trap signals | Genuinely undervalued signals |
|---|---|---|
| Uniform vs as-reported earnings | As-reported earnings inflated versus underlying earnings. Uniform P/E higher than it looks | As-reported earnings depressed versus underlying earnings. Uniform P/E lower than it looks |
| Uniform return trend | Uniform ROA falling toward or below the cost of capital | Uniform ROA durable above the corporate average |
| Cash conversion | Below 1.0 and propped up by working-capital timing | Near or above 1.0 on a repeatable basis |
| Why it’s cheap | Cheapness ties to accounting effects or fading economics | Cheapness ties to a temporary issue you can name |
| Management tone vs numbers | Optimistic narrative with weakening return and cash patterns | Measured narrative with stable return and cash patterns |
| Balance sheet and payouts | Dividends or buybacks bridged by rising debt or asset sales | Payouts covered by cash generation, with reinvestment discipline |
The FA Alpha 50 runs this sequence every month across 25,000+ companies on Uniform Accounting numbers. The FA Alpha 50 page walks through how the list is built.
What to Say to Clients
When a Client Brings You a Cheap Stock
“It’s at 8.5 times reported earnings. On Uniform earnings it’s 14.8 times, for a business whose returns run below its cost of capital. Cheap is the wrong word.”
When a Client Asks Why You Own Something That Looks Expensive
“It looks expensive because it expenses a big R&D budget and carries goodwill from an acquisition. On underlying earnings it’s 9 times, and it has earned double its cost of capital for five years. The market is pricing it as if that stops.”
When a Client Is Impatient with a Holding That Hasn’t Moved
“The business earned 16% on its capital again this year. The price will catch up or it won’t, but while we wait, the company is compounding value. That’s the difference between patience and hope.”
Key takeaways
- Undervalued means the price assumes less than the business delivers. A low multiple is often the opposite.
- Cheap screens select for inflated earnings and declining businesses, and miss the quality hidden by expensed R&D and acquisition goodwill.
- Clean the numbers, screen for durable Uniform ROA and cash conversion, then ask what the price assumes.
- Every genuinely undervalued stock is cheap for a reason. Write the reason down and decide if it’s temporary or structural.
Frequently Asked Questions
What Is an Undervalued Stock?
An undervalued stock is one priced for less than the business has delivered on a cleaned, comparable basis. A low multiple by itself doesn’t qualify. The target is a mismatch between the durability the price implies and the durability the record shows.
How Do You Find Undervalued Stocks Without Falling for Value Traps?
Clean as-reported financials first, then screen for durable Uniform ROA and cash conversion, then test what the valuation implies. If you start with a low P/E or a low price-to-book, you’ll select for accounting effects instead.
Is a Low P/E or High Dividend Yield a Reliable Signal of Undervaluation?
No. Both can be artifacts of temporarily inflated as-reported earnings, underinvestment, or payouts funded by balance-sheet stress. They can still serve as triage signals once you’ve adjusted earnings and confirmed return durability.
Can a High-P/E Stock Still Be Undervalued?
Yes. When expensed R&D or acquisition goodwill depresses reported earnings, the as-reported P/E overstates the price. On underlying earnings the same stock can be inexpensive, and its returns on capital tell you if the business deserves a higher multiple than the market gives it.
One company on the numbers, every morning
FA Alpha Daily applies this to one company, metric, or market signal every morning, free for financial advisors.