Stock Screener


The FA Alpha Stock Screener

A Stock Screener That Screens on Real Earnings, Not Reported Ones

Every other screener runs on as-reported GAAP data, so every other screener finds the same value traps. This one filters 25,000+ companies on Uniform Accounting numbers, with more than 130 distortions removed, and shows you the as-reported figures beside them so you can see exactly where the accounting was hiding the business.

Free to try. Full results and exports for FA Alpha members.
25,000+companies, all restated
130+accounting distortions removed
2numbers for every metric: Uniform and as-reported
Monthlydata refresh, every company, every period
The Problem

Why a good stock screener is so hard to find

There are dozens of free screeners and they all produce the same list, because they all run on the same as-reported data. Three problems follow.

The inputs are distorted

A “low P/E” built on earnings inflated by capitalized costs and recurring “one-time” charges is not low. A “poor ROA” depressed by acquisition goodwill and expensed R&D is not poor. Every filter inherits every distortion in the filings.

It finds value traps by design

Screen for cheap and you get the companies whose reported earnings are highest relative to price. Those are disproportionately the ones whose reported earnings are least real. The screen selects for the problem.

It misses what everyone misses

The businesses worth finding are the ones the market misprices, and the market misprices them precisely because the reported numbers hide them. A screener built on those numbers can’t see them either.
The Tool

Screen on Uniform numbers, see the as-reported numbers beside them

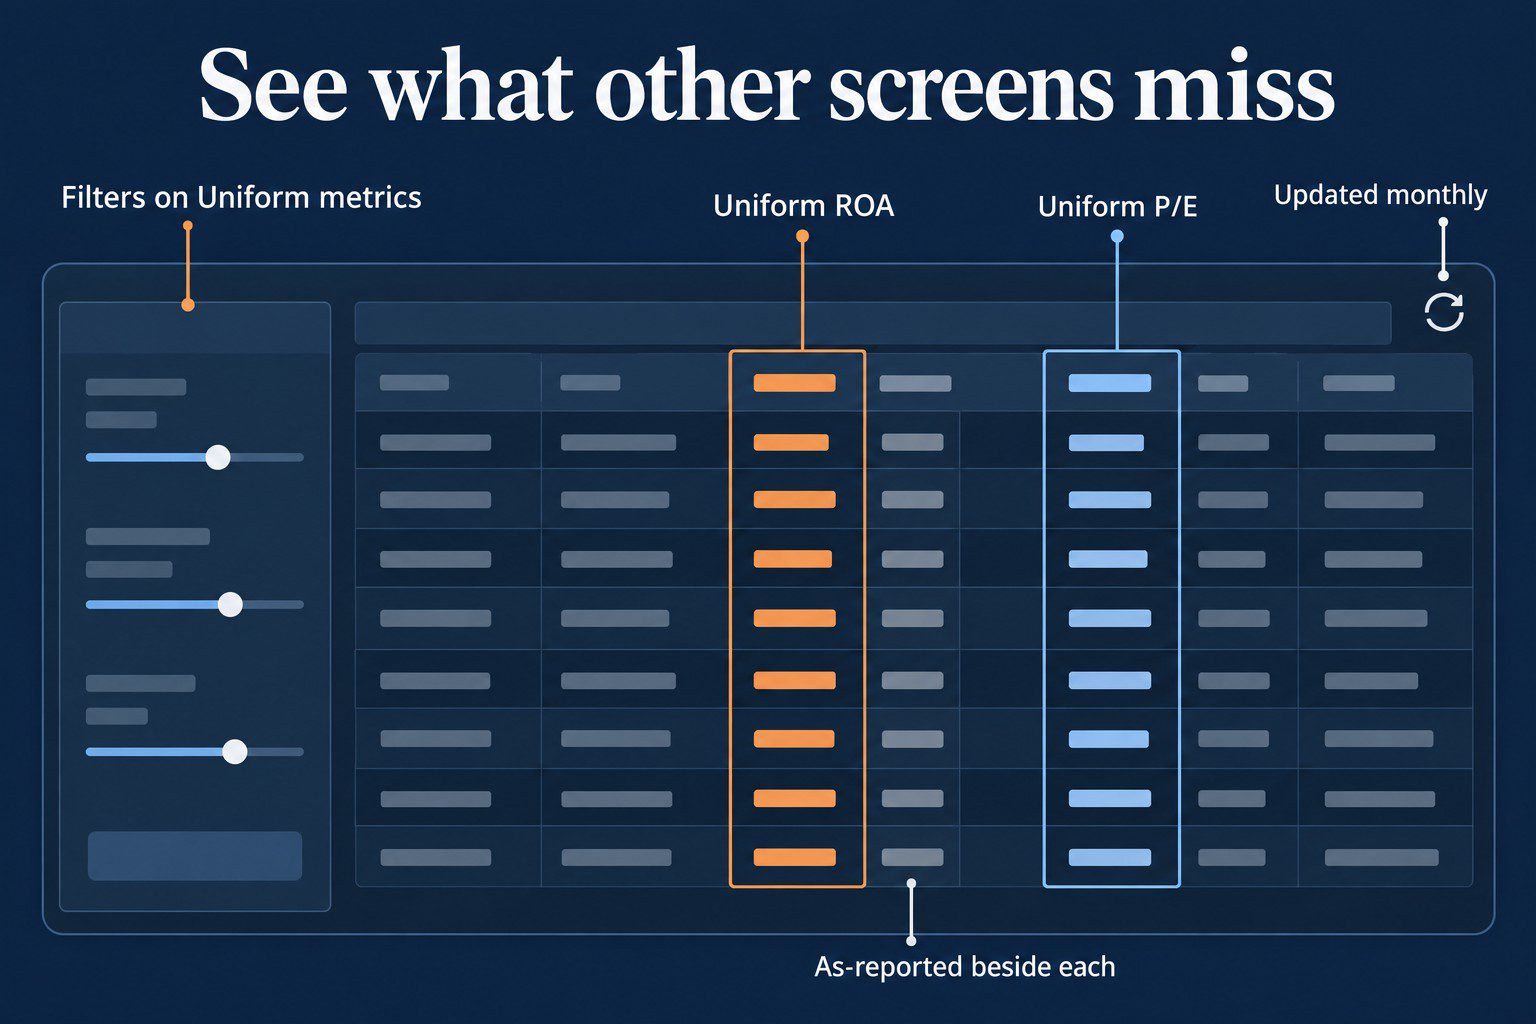
Set your filters on the cleaned-up metrics. Every result shows both versions of each number, and a verdict on what the gap between them means.

FA Alpha ScreenerUniform Accounting data · updated monthly · 25,000+ companies
12%
18x
0.9x
$1B and above
All sectors
Run screen →
CompanySectorUniform ROAAs-reported ROAUniform P/EAs-reported P/EVerdict
Meridian Industrial Co.Industrials17%6%13x22xHidden quality
Northgate Software Inc.Technology24%9%16x41xHidden quality
Harbor Consumer BrandsConsumer staples14%12%17x19xFairly reported
Atlas Health SystemsHealth care15%4%12x35xHidden quality
Summit Retail GroupConsumer discretionary13%11%15x16xFairly reported
Pioneer Energy PartnersEnergy12%14%18x9xCheaper than it looks? No
Design mock with illustrative rows. Not actual companies or recommendations. Members see full names, 40+ Uniform metrics, and exports.
The Method

Four kinds of stock a normal screener can’t tell apart

Put as-reported valuation on one axis and Uniform valuation on the other, and the market splits into four groups. A conventional screener only sees the horizontal axis.

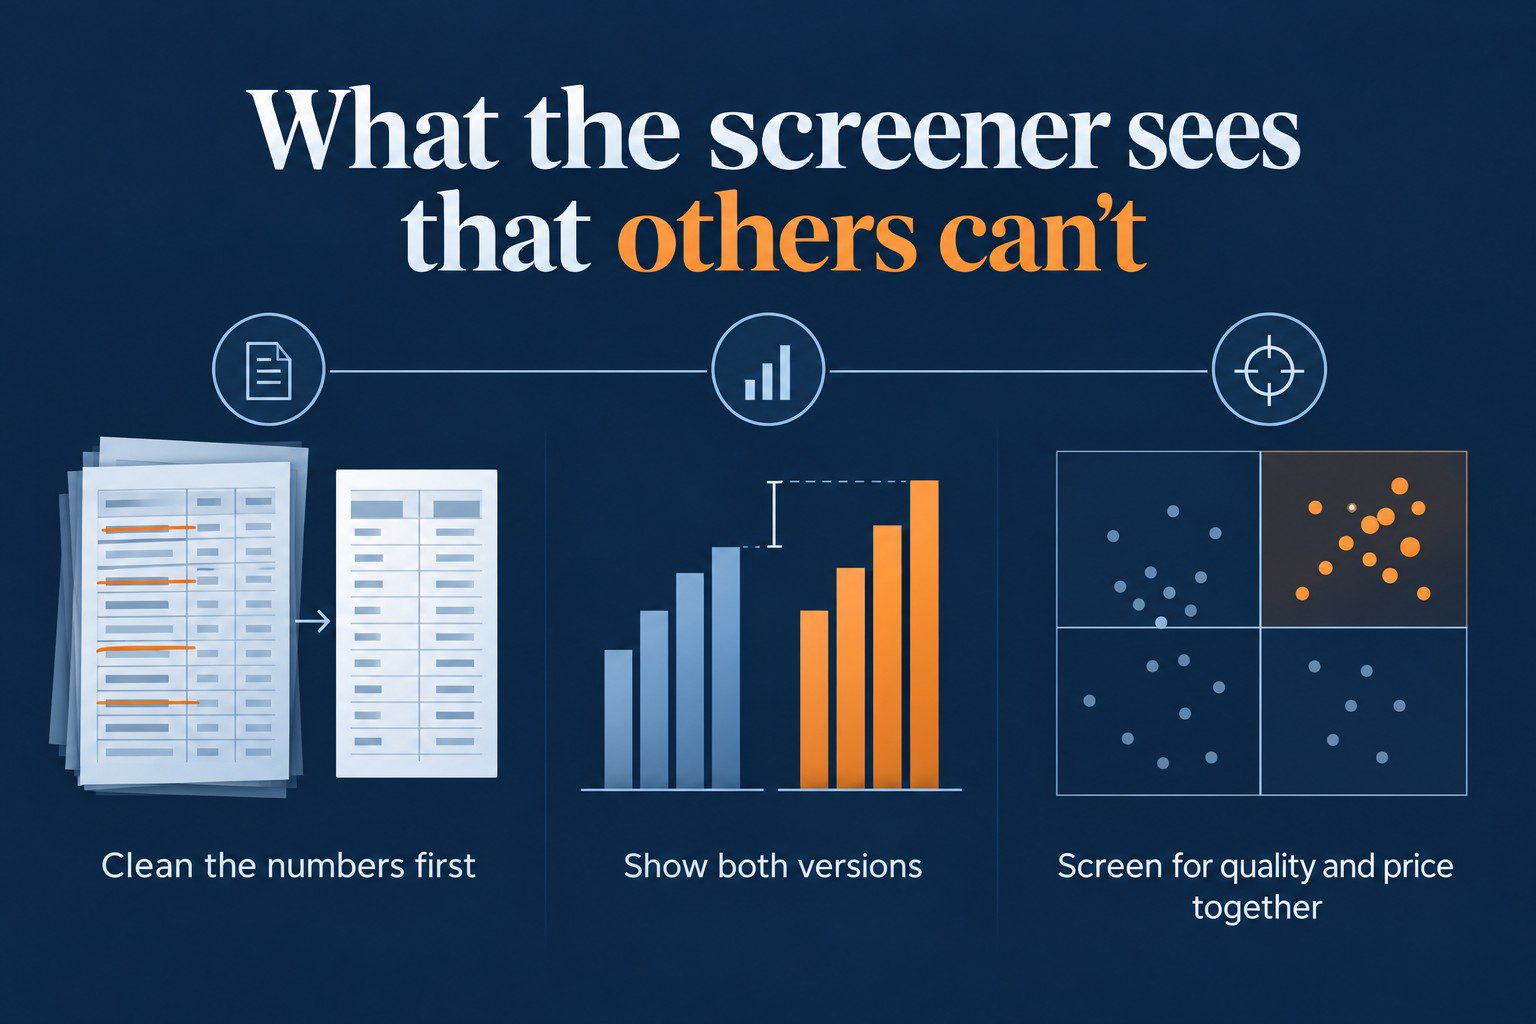
What the Screener Sees That Others Can’t FA ALPHA GENUINE BARGAIN HIDDEN QUALITY VALUE TRAP PRICED FOR PERFECTION Cheap on both. Rare, and everyscreener finds it. Looks expensive, is cheap. Real earningsdepressed by R&D or goodwill accounting. Looks cheap, is expensive. Reportedearnings inflated by accounting choices. Expensive on both. The marketalready knows. Conventional screeners: YES Conventional screeners: MISS IT Conventional screeners: SELECT IT BY MISTAKE Conventional screeners: correctly avoid LOOKS CHEAP (AS-REPORTED) LOOKS EXPENSIVE (AS-REPORTED) ACTUALLY CHEAP (Uniform numbers) ACTUALLY EXPENSIVE (Uniform numbers) A conventional screener only sees this axis
1

Clean the numbers first

Every company is restated under Uniform Accounting before it enters the screen, so filters run on comparable returns and multiples rather than on whatever each management team chose to report.

2

Show both versions

Each metric appears twice: Uniform and as-reported. The gap between them is the analysis. A big gap in the right direction is where the ideas are. A big gap in the wrong direction is the trap you just avoided.

3

Screen for quality and price together

Uniform ROA and cash conversion for quality, Uniform P/E against implied expectations for price. The default filters match the tests behind the FA Alpha 50, and every filter is adjustable.

Common Questions

Screener questions advisors ask

Is it free?

The screener is free to try with a limited result set. FA Alpha members see full company names, the complete Uniform metric set, and exports. The free FA Alpha Daily newsletter is the easiest way to see the method before joining.

What is Uniform Accounting?

A framework of more than 130 adjustments that restates as-reported financial statements onto one comparable basis: removing goodwill from the capital base, putting leases back on the balance sheet, capitalizing the investment GAAP expenses, and treating recurring “one-time” items as the operating costs they are. Our Knowledge Base page on why GAAP earnings distort profitability explains each adjustment.

Are the results recommendations?

No. FA Alpha is a research publication, and the screener is a research tool. It surfaces companies whose Uniform numbers meet the criteria you set. Whether any of them fits a client is the advisor’s decision, and nothing on this page is individualized investment advice.

How is this different from the FA Alpha 50?

The FA Alpha 50 is the fifty names that pass our analysts’ full process each month, including earnings call forensics and credit work. The screener lets you run your own version of the first two steps, quality and valuation, with your own thresholds, across the whole database. See how the list is built on our best stocks to buy now page.

Stop screening on numbers everyone else already has

Start with FA Alpha Daily, free: one company, metric, or market signal every morning, on Uniform Accounting numbers. Get FA Alpha Daily

Investment research for financial advisors, built on the Uniform Accounting framework by the team at Valens Research.

+1 630-841-0683

FA Alpha is a research publication of Valens Research. The information on this page is for informational and educational purposes only and is not individualized investment advice or a recommendation to buy or sell any security. Investing involves risk, including possible loss of principal. Past performance does not guarantee future results.

© 2026 Valens Research. All rights reserved.

Please fill out the fields below so that our client relations team can contact you.

Or contact our Client Relationship Team at +1 630-841-0683