What are some reliable ways to find high-quality, high-growth stocks that are still reasonably priced?
Quick answer
Run three tests, in order, on Uniform numbers. First test for durable returns, then for growth that has already happened, then for a price that requires only what the company has already delivered. As-reported screens fail all three, because reported earnings understate the heaviest reinvestors.
Durable returns means Uniform return on assets above the corporate average for several years, with cash from operations keeping up with earnings. Growth that has already happened means five years of rising Uniform earnings and a growing asset base. A reasonable price means today’s Uniform P/E requires only a growth rate the company has already delivered.
A reliable method is one you can explain to a client and a compliance officer. A trailing P/E screen on reported earnings can’t do that. The three tests below can, and each one has an as-reported trap beside it.
Three Tests
1. Durable returns
Quality means returns that persist. Start with Uniform return on assets (“ROA”), which is Uniform earnings divided by the operating asset base. Uniform Accounting measures both, using more than 130 adjustments that make financial statements comparable across companies.
Look for several years of Uniform ROA above the 12% corporate average, FA Alpha’s benchmark. Cash from operations should keep pace with earnings.
The as-reported trap is expensed investment. A company that expenses its R&D and holds excess cash reports a small return on a bloated asset base. The screen drops it for the wrong reason.
2. Growth that has already happened
A five-year record finds growth without a forecast. Once a company clears the quality bar, check that Uniform earnings have compounded and the operating asset base has grown. That growth should come from reinvestment that earned more than it cost.
The as-reported trap is the one-year spike. Easy comparisons, restructuring, or an acquisition can make a single year look like growth. The Uniform view asks a different question. Did underlying earnings rise year after year while the business reinvested, or did the company buy its growth?
3. A price that assumes only what the record supports
A company that passes the first two tests can still fail the third, if the price already assumes a step up the record doesn’t show. Turn the multiple around. What rate of Uniform earnings growth does today’s Uniform P/E require, and has the company delivered that rate before? That’s the Embedded Expectations Analysis the FA Alpha Daily runs on one company at a time.
The as-reported trap is the reinvestor that only looks expensive. Expensed investment shrinks reported earnings, so the reported P/E looks stretched while the Uniform P/E is near the market. The same test, run the other way, shows if a stock is overvalued.
| Test | What to check, on Uniform numbers | As-reported trap |
|---|---|---|
| 1. Durable returns | Uniform ROA above the 12% corporate average for several years, and cash from operations that keeps up with earnings | Expensed R&D and excess cash depress reported ROA |
| 2. Growth already happened | Five years of compounding Uniform earnings and a growing operating asset base | One-year spikes from easy comparisons, restructuring, or acquisitions |
| 3. Reasonable price | The growth today’s Uniform P/E requires is a rate the company has already delivered | Expensed investment inflates reported P/E and hides the underlying multiple |
Example: A Software Company
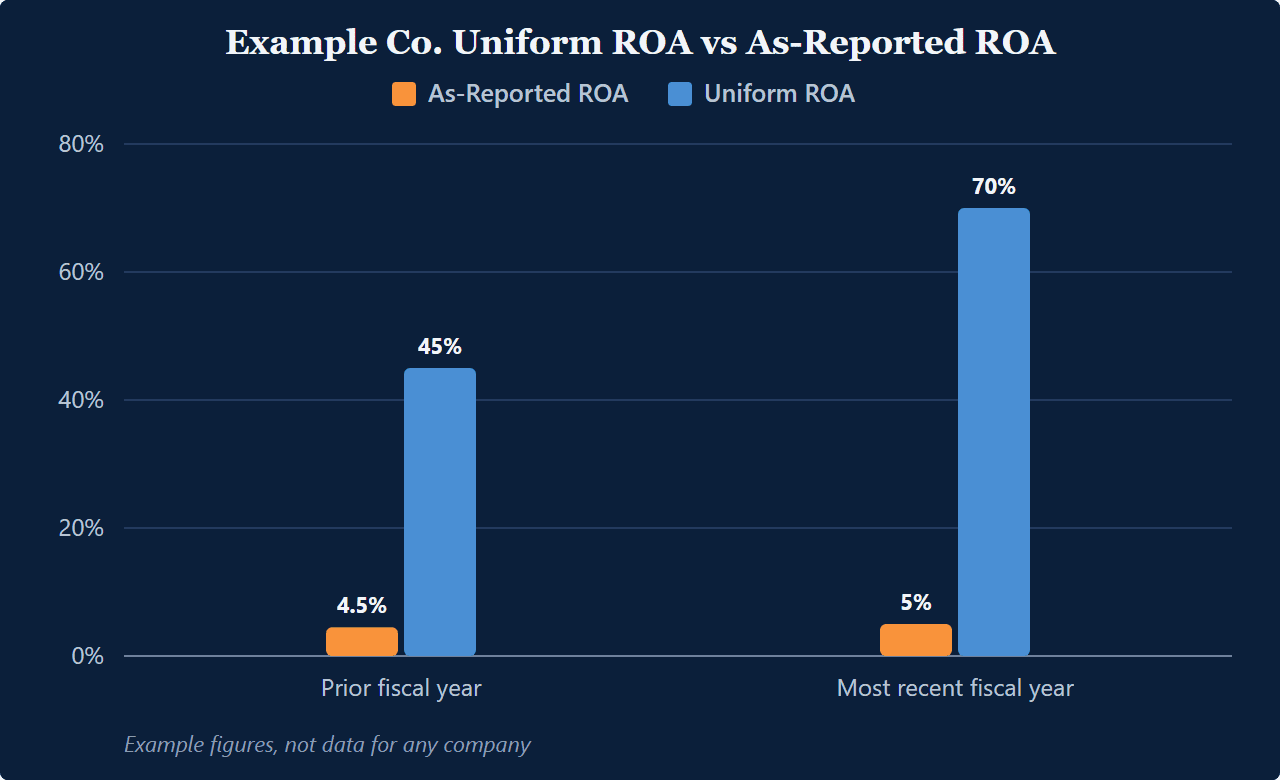
Take Example Co., a software business. These are example figures, not data for any company. On as-reported numbers it showed a 4.5% ROA in its prior fiscal year and 5% in its most recent, both well below the 12% corporate average, with a forward P/E of 32x and then 17x. It looks low-return, and in the prior fiscal year expensive too, so a growth-at-a-reasonable-price screen drops it at the first test.
On Uniform numbers, after the adjustments to earnings and the operating asset base, Uniform ROA was 45% in the prior fiscal year and 70% in the most recent. Uniform earnings per share rose from $11.00 to $12.40 over those two years, and the Uniform forward P/E was 28x and then 15x, below the reported multiple both times. The reported numbers said low-return. The Uniform numbers say high-return, growing, and priced below what the reported multiple suggests. All figures here are example figures, not data for any company.
At 15x Uniform forward earnings, the third test asks what rate of growth that multiple requires and if Example Co. has delivered it. Two fiscal years of rising Uniform earnings are a start on that record, not the five-year record the test wants. These figures alone don’t settle the third test.
How FA Alpha Runs the Three Tests
FA Alpha puts 25,000+ companies on a Uniform Accounting basis and screens them for durable Uniform ROA and cash conversion. Then it tests each survivor against the expectations in its price. The FA Alpha 50 is the monthly output of that screen.
Valens Research, FA Alpha’s parent, applied the same read to the whole market in its August 2026 Market Phase Cycle Monitor. The Monitor called it “a GARP market, as investors are not yet paying up for growth.” The same logic, one company at a time, is how FA Alpha looks for undervalued stocks.
The tests need extra care in three places. In financial companies, the balance sheet is the product, so operating adjustments don’t apply cleanly. Pre-earnings companies have no record to test the price against.
The third is serial acquirers, whose growth record has to be separated from what they bought. The earnings quality checks matter most there. A stock screener built on Uniform numbers is where that work starts.
Key points
- Quality, growth, and price are three separate tests, run in that order on Uniform numbers.
- As-reported screens miss heavy reinvestors, because expensed investment understates their returns.
- A price is reasonable when the growth it requires is a rate the company has already delivered.
See the three tests run on one company every morning
FA Alpha Daily applies this to one company, metric, or market signal every morning, free for financial advisors.