
Stock Screener: What Every Filter Inherits From the Filings
November 3, 2026
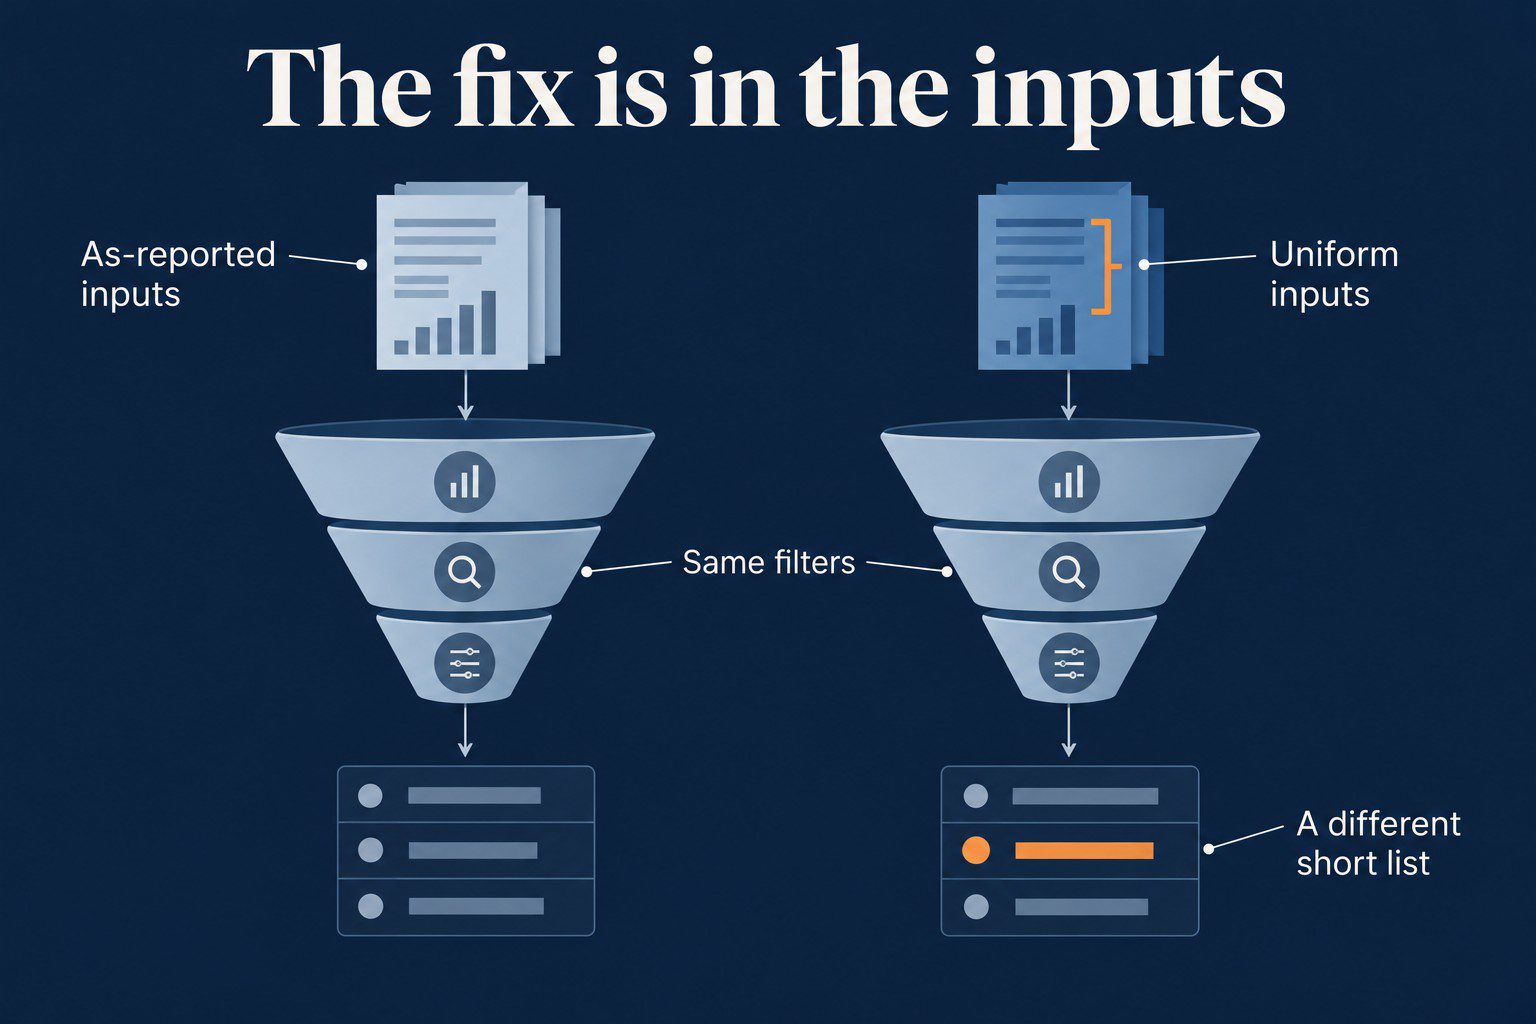
A stock screener is a set of filters on valuation, profitability, growth, and size, run across thousands of companies to produce a short list worth researching. Every popular screener runs those filters on the figures as reported in the filings, which is why Finviz, TradingView, and Yahoo Finance keep producing the same list. The FA Alpha stock screener runs the same filters on Uniform Accounting numbers for 25,000+ companies, with more than 130 accounting distortions removed, and shows the as-reported figure beside each Uniform figure. It’s free to try.
A screen on reported earnings and assets inherits every accounting choice inside them. So a screen for cheap selects, by design, for the companies whose reported earnings are least comparable. The fix is in the inputs rather than in more filters.
Key points
- Finviz, TradingView, and Yahoo Finance find the same names because they filter the same fundamentals.
- In an example, a stock screens cheap at an as-reported P/E of 11 while its Uniform P/E is 18.
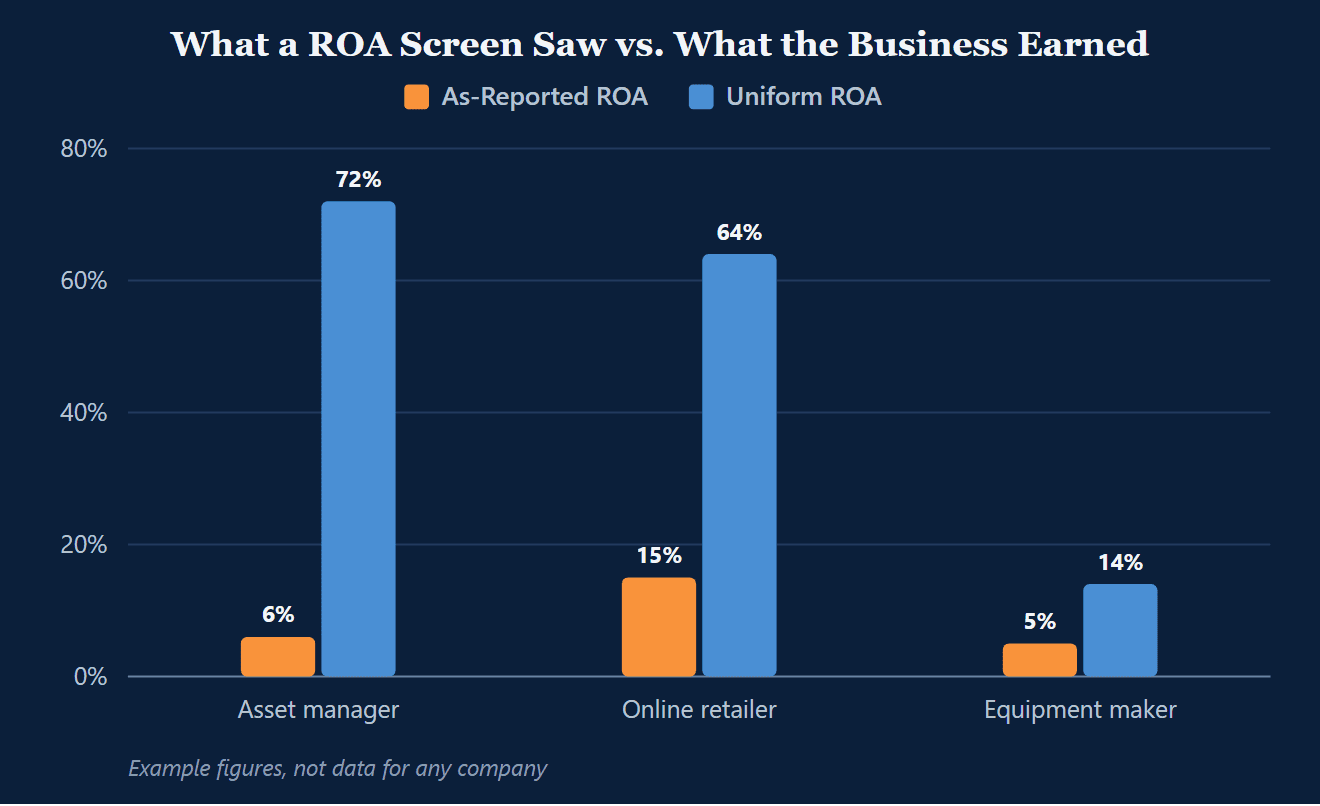
- In an example, a 6% as-reported ROA sits against a 72% Uniform ROA, strength screens drop.
- As-reported against Uniform valuation splits stocks into four kinds a screener can’t tell apart.
- Order your filters with Uniform ROA first, Uniform asset growth second, and Uniform P/E last.
Why Does Every Stock Screener Find the Same List?
Finviz, TradingView, and Yahoo Finance produce the same names because they filter the same fundamentals. If the filter is P/E, forward P/E, PEG, price to book, ROA, or margins, the figure comes from the financial statements as reported, and none of those screener pages says where the figure comes from or names any adjustment to it. The interface changes. The 10-K line items feeding the ratios don’t, so the short list converges.
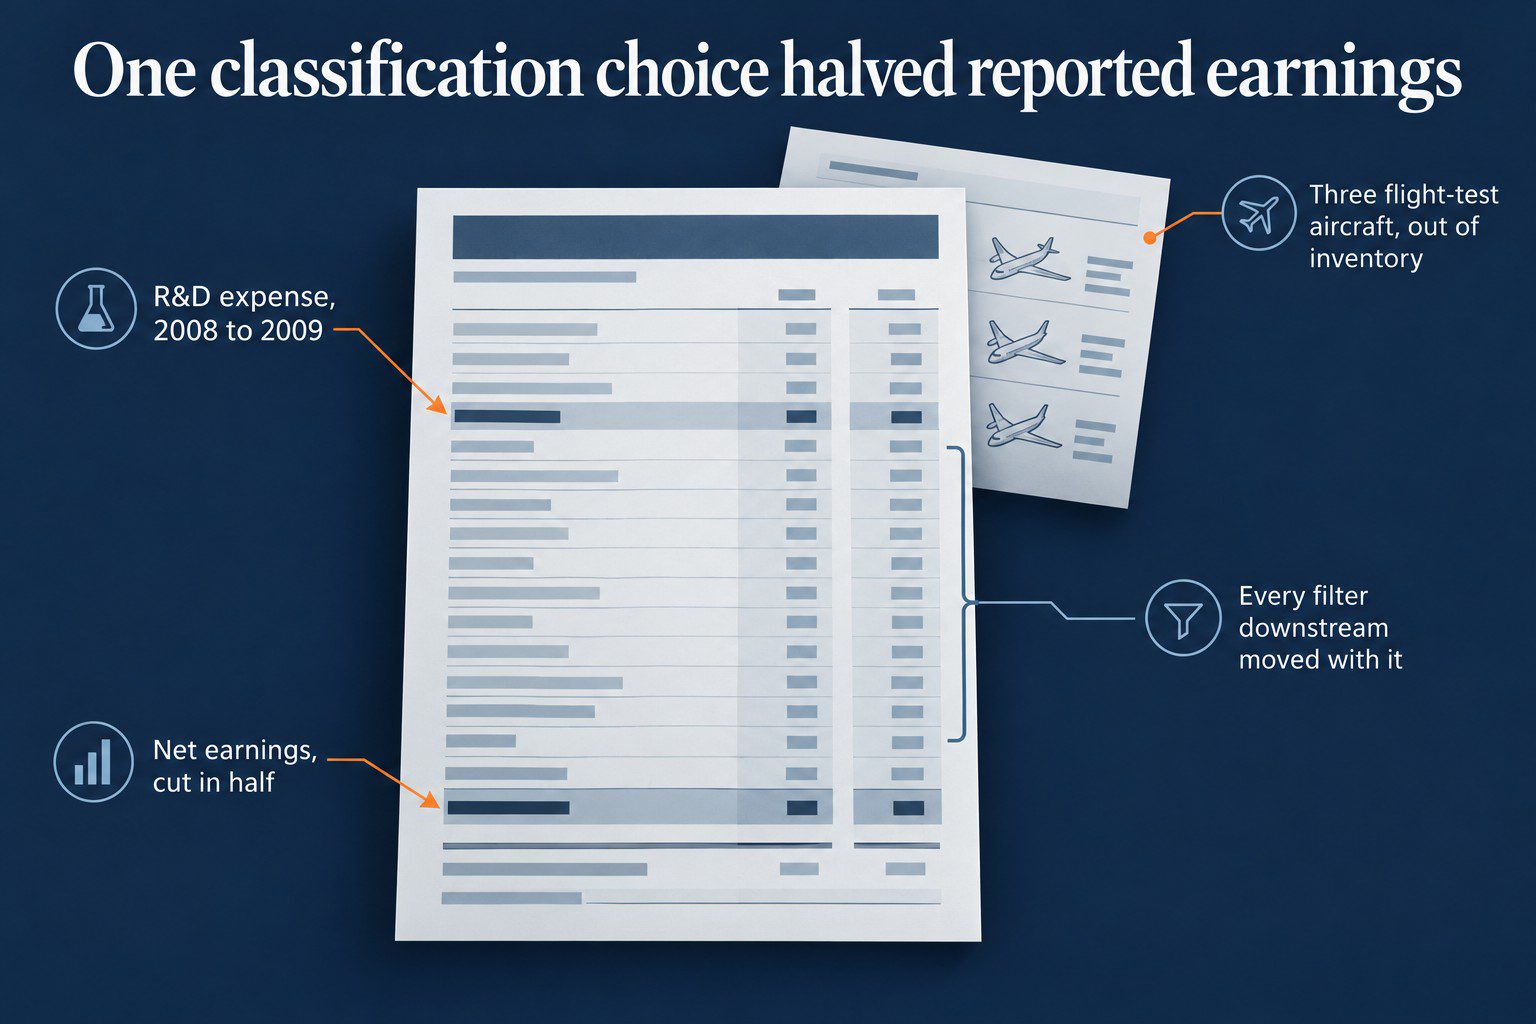
Take an aircraft maker to see how one classification choice moves every filter. These are example figures, not data for any company. Research and development expense rises from $3.7 billion to $6.4 billion in a year, and net earnings fall from $2.6 billion to $1.3 billion. Most of that jump is one decision. The company concludes that three flight-test aircraft can’t be sold and moves $2.4 billion out of inventory and into R&D expense. Three airplanes move from the balance sheet to the income statement, and a screen reading the reported statements sees a company whose earnings have halved.
Fixing one ratio won’t fix the ranking. Uniform Accounting makes over 130 adjustments to put companies on one comparable basis. In a February 11, 2025 lecture at Emory & Henry, Joel Litman said “there is only five or seven that matter” at any one company, and “it is a different five at every company.” When you rank 25,000 companies at once, the only way to stop sorting on accounting policy is to clean every company’s numbers first, then filter. Reading the filings the way a forensic accountant does is where those adjustments come from.
What Does a Screen for Cheap Select For?
Screen for cheap on as-reported P/E and you select, by design, for the companies whose reported earnings are highest relative to price. When the earnings in the denominator aren’t comparable across companies, the list holds more than turnarounds and cyclical troughs. It also loads up on names where the reporting flatters profitability.
Take a packaged food company. These are example figures, not data for any company. It trades at an as-reported P/E of 11 and a Uniform P/E of 18, about the market average. A screen for cheap puts it on the list. The Uniform number says it’s ordinary. That’s why a low P/E screen wastes so many hours of 10-K and earnings-call review.
Separating a genuine bargain from a value trap is its own process, covered on the undervalued stocks page, and no screener does it for you.
What Does a Screen on Reported Numbers Miss?
A screen on reported metrics also excludes companies with a high Uniform ROA and a low as-reported ROA before they reach research. When a business builds its capability in-house, it expenses the R&D as it goes, and reported earnings fall. When it grows through deals, acquisition goodwill stays in the asset base for years, and reported returns fall. Either way, a quality filter or a cheap filter screens out strength.
Take an asset manager. These are example figures, not data for any company. Its as-reported return on assets is a modest 6%, while its Uniform return on assets, or ROA, is 72%. The problem with a conventional ROA screen is rarely the cutoff. The input doesn’t measure the same thing at every company.
The same gap appears outside asset management, again on example figures. An online retailer’s as-reported ROA is 15%, while its Uniform ROA is 64%. An equipment maker’s as-reported ROA rises from 3% to 5% over two years while its Uniform ROA falls from 20% to 14%. The two numbers don’t even agree on which way the business went.
Now take a consulting firm, again on example figures. It looks expensive at an as-reported P/E of 24 while its Uniform P/E is 17. Screening out low ROA or high P/E on reported numbers is less conservative than it sounds. It can be a screen against the accounting rather than the business.
Which Four Kinds of Stock Can’t a Screener Tell Apart?
Put as-reported valuation on one axis and Uniform valuation on the other, and the market splits into four groups. A conventional screener sees only the as-reported axis.
| As-reported view | Cheap on Uniform numbers | Expensive on Uniform numbers |
|---|---|---|
| Cheap on as-reported numbers | Genuine bargain: Cheap on both. Rare, and every screener finds it. | Value trap: Looks cheap, is expensive. Reported earnings flattered by accounting choices. |
| Expensive on as-reported numbers | Hidden quality: Looks expensive, is cheap. Uniform earnings depressed by R&D or goodwill accounting. | Priced for perfection: Expensive on both. The market already knows. |
The examples above fall into the grid. The packaged food company looks cheap on as-reported P/E and doesn’t on Uniform P/E, the value-trap corner. The asset manager, the online retailer, and the consulting firm look expensive or ordinary on as-reported numbers and aren’t on Uniform numbers, the hidden-quality corner. They’re examples, not a view on any company.
How Should You Order the Filters?
Start with quality, and the rest of the work stays on businesses that clear a basic economic bar. Start with price, and the calendar fills with names that only look cheap because the accounting flattered the denominator. Filter order decides which companies get the research hours. Saying you’ll research it later doesn’t help, because everything downstream only ever evaluates the names that made the list.
FA Alpha’s published method screens Uniform ROA first, as the quality gate. Uniform asset growth comes second, to see if the company is putting more capital to work at those returns. Uniform price to earnings (P/E) comes last, so price sorts only the names that cleared quality and growth. The bar for the first gate is the corporate average Uniform ROA, so a company has to earn more on its assets than the typical company does. The FA Alpha screener’s default filters match the tests behind the FA Alpha 50, and every filter is adjustable. If the earnings in the denominator aren’t comparable, the P/E screened on them isn’t either.
What Is the Short List For?
A screen produces a list, never a verdict. The first job after any screen is to work out what the current price already assumes about the business. From there, test the cash flows against the company’s obligations, the way the cash flow statement page walks through, then go back through the filings and the calls.
The FA Alpha 50 is the fifty names that pass FA Alpha’s analysts’ full process each month, including earnings call forensics and credit work, which the screener doesn’t run. The screener lets you run your own version of the first two steps, quality and valuation, with your own thresholds, across the whole database. FA Alpha is a research publication, and nothing on a screen or a list is individualized investment advice. Doing this across a book of clients every month is a data job, and the research platforms page compares the tools that do it.
Key takeaways
- Popular screeners return the same names because they filter the same as-reported figures from the filings.
- A screen for cheap on as-reported P/E selects for the companies whose reported earnings are least comparable, which is where value traps collect.
- Expensed R&D and acquisition goodwill push reported returns down, so a quality filter on reported numbers can screen out strength.
- Run Uniform ROA first, Uniform asset growth second, and Uniform P/E last, then treat the short list as where research starts.
Frequently Asked Questions
Is the FA Alpha Stock Screener Free?
The screener is free to try with a limited result set. FA Alpha members see full company names, the complete Uniform metric set, and exports.
What Is the Best Free Stock Screener?
Most roundups name the same free tools, Finviz, TradingView, and Yahoo Finance. The difference between them is the wrapper. All three run their filters on as-reported fundamentals, so the best one still produces the same short list.
What Filters Should a Stock Screener Use?
Set quality first, then growth, then price. In FA Alpha’s published method that means Uniform ROA, then Uniform asset growth, then Uniform P/E, because a price-first screen loads the list with names that only look cheap.
Does a Low P/E Screen Find Undervalued Stocks?
Not reliably. A low as-reported P/E selects for the companies with the highest reported earnings relative to price, and reported earnings aren’t comparable across companies when the accounting treatment decides the denominator. Separating a genuine bargain from a value trap is its own process, on the undervalued stocks page.
One company on the numbers, every morning
FA Alpha Daily applies this to one company, metric, or market signal every morning, free for financial advisors.