Best Research Platforms for Financial Advisors: How 8 Popular Tools Compare
August 29, 2026

The best research platform for a financial advisor depends on which of two jobs you’re buying. One job is data and client-facing output, meaning screening, charts, and meeting-ready exhibits. The other is ideas and analysis, meaning a view of underlying earnings and risk that holds up in a committee memo and a compliance review. Most firms need one tool for each, and the eight compared below split cleanly along that line.
Full disclosure, FA Alpha publishes this comparison, and its own research service is on the list, at number one. The case for that ranking is below, alongside the case for each of the other seven.
Research Has Two Jobs
Most platform lists don’t help because they grade everything on one scale. Without the split, you’ll add features and still lack the research you need. So ask one question in every demo. Does this platform mainly produce tear sheets and proposal charts, or does it change your conviction when the as-reported number and the Uniform number diverge? If it claims both, ask which output it was built for first.
Five Questions Before You Shop
Start with your bottleneck rather than the feature list. If you buy a platform to fix the wrong job, you’ll add a login and still write the memo in Excel.
- Which job is your bottleneck right now, client-facing output or ideas and analysis? A team that can’t produce clean exhibits fast will under-communicate. One that can’t explain a position beyond a narrative will over-explain.
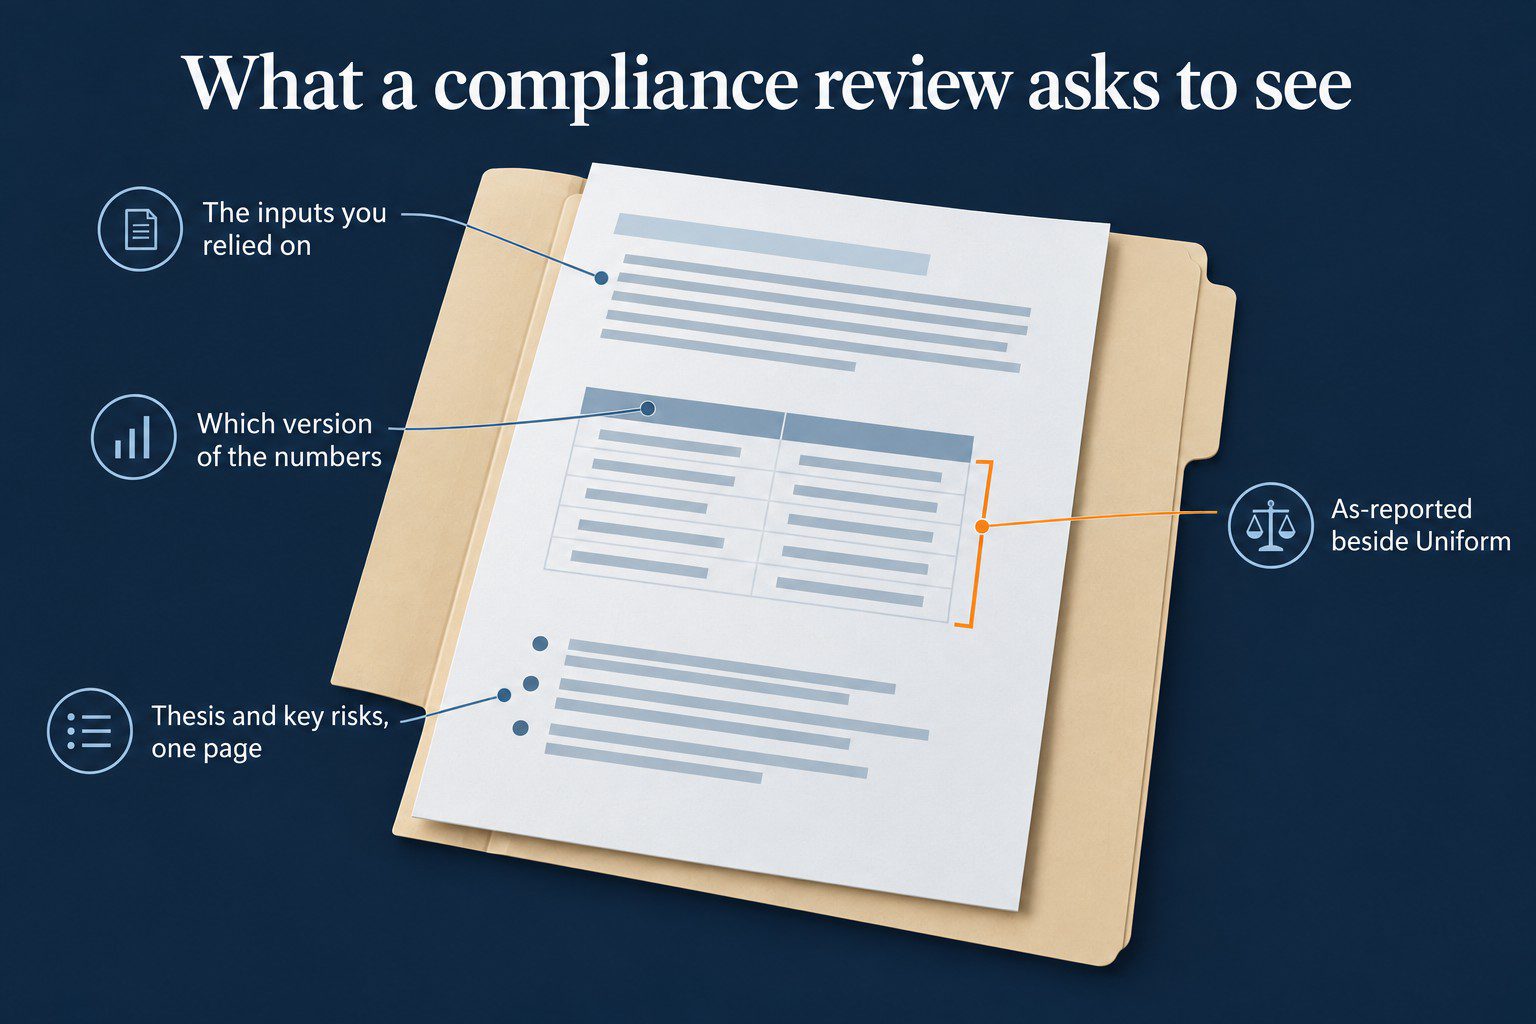
- Could a position built on this tool hold up in a compliance review? Ask what you’d attach to a trade review: the inputs and the version of the numbers you relied on.
- Are the numbers underneath cleaned up, or just presented neatly? Look for whether the platform shows as-reported metrics beside Uniform ones and explains what drove the difference.
- What does it produce that a client can see without extra work? Can you export a meeting-ready page that matches how you talk, with the thesis and key risks rather than a screen of ratios?
- What’s the cost per idea you’ll use? If you cover 30 names but use the tool’s output for 5, the cost per usable idea is the number that matters, not the sticker price.
Eight Investment Research Platforms Compared
You’re usually buying two tools instead of one. Prices below are approximate August 2026 list prices and change often. The comparison is qualitative, based on each vendor’s stated offering and intended audience.
| Platform | Primary job | Best for | Approx. annual cost | Main limitation |
|---|---|---|---|---|
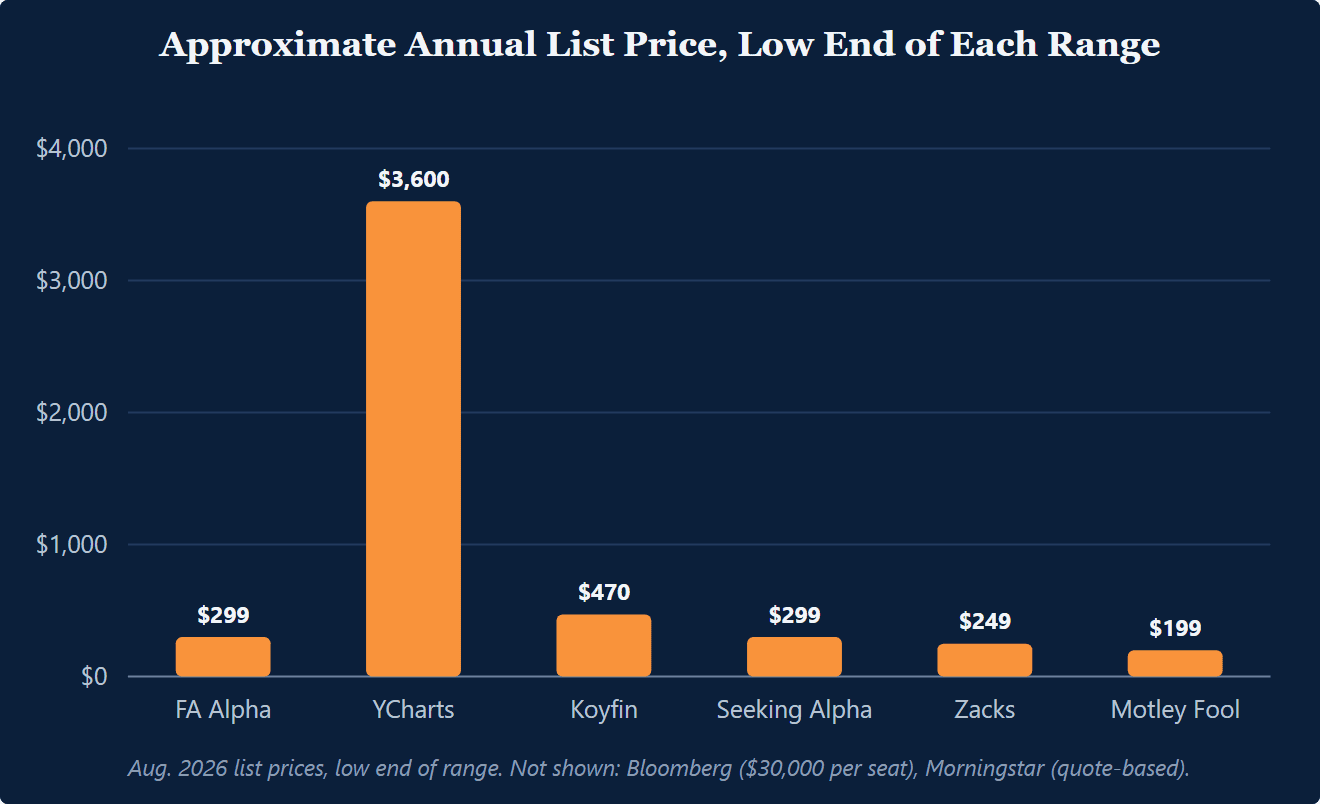
| FA Alpha | Ideas and analysis, plus Uniform data | Fundamental write-ups on Uniform financials | Free daily, then $299 (Pulse) to $897 (full membership) | No charting, fund database, or proposal generator |
| YCharts | Data and client-facing tools | Advisor-ready charts, screening, and report output | Roughly $3,600 to $6,000 | Great exhibits don’t explain what changed in underlying earnings |
| Koyfin | Data and client-facing tools | Broad market data and dashboards at a lower entry price | Roughly $470 (Pro) to $2,500 (advisor tiers) | Team-wide licensing and client-ready packaging can become the constraint |
| Morningstar Advisor Workstation | Data and client-facing tools | Fund and manager research with advisor workflow integration | Quote-based, often bundled through broker-dealers | Single-stock thesis work still needs a separate service |
| Bloomberg Terminal | Data and client-facing tools | Maximum breadth: markets, news, analytics | Roughly $30,000 per seat | Cost and training burden rarely fit a small team |
| Seeking Alpha Premium | Ideas and analysis | Idea flow and bull-bear debate on public equities | About $299 | Conclusions rest on as-reported metrics and author framing |
| Zacks Premium | Ideas and analysis | Screening and rating-driven idea generation | About $249 | Model-led output with limited transparency into what’s behind the numbers |
| Motley Fool Stock Advisor | Ideas and analysis | Straightforward stock ideas for individuals | About $199 | Not built for committee notes or compliance documentation |
FA Alpha
FA Alpha ranks first here as the best research service for financial advisors, and the reason is the data underneath it. The platform adjusts the statements of more than 25,000 companies under Uniform Accounting, with more than 130 adjustments per company. That data feeds the FA Alpha 50 (fifty vetted ideas a month, with the reasoning attached), FA Alpha Pulse (monthly macro and allocation signals), FA Alpha Academy (training for client conversations), and a free daily email. Members also get the Uniform Accounting database itself, so it covers Uniform data as well as ideas. Sign up for FA Alpha, or start with the free daily.
Uniform Accounting adjusts as-reported statements so metrics like Uniform return on assets (ROA) compare cleanly across companies and over time. What FA Alpha is not is a terminal. There’s no charting, no fund database, and no proposal generator, so most members pair it with one of the data tools below.
YCharts
YCharts is a data and output platform that shines when you need clean charts, screeners, and client-ready reports. If you’re building a quarterly client update with factor exposures, benchmark comparisons, and performance exhibits, it saves real time.
You still have to decide what you believe about underlying earnings when the story and the as-reported ratios disagree. YCharts gives you the material to show a client what you already think.
Koyfin
Koyfin covers a lot of ground for the price: dashboards, charts, and broad data access without terminal-level cost. It’s useful for a quick check of a name’s history, peers, and macro context before you decide whether it deserves deeper work.
The pressure point for RIAs is usually scaling seats across advisors and paraplanners, plus the work of turning the output into a client-ready page.
Morningstar Advisor Workstation
Morningstar’s advisor product is built around the deepest managed-product database in the industry, with the ratings and X-ray tools that broker-dealer compliance departments already know. It works well when your research needs center on fund selection and holdings context.
It supports the client-facing and oversight side of the job. It won’t replace a separate workflow for single-stock thesis work or for showing as-reported versus Uniform fundamentals.
Bloomberg Terminal
Bloomberg is the broadest data environment on this list, with markets, news, analytics, and the messaging network that makes it sticky. If you need all of that in one place, it’s built for it.
Bloomberg is still a tough fit for smaller firms. A $30,000-per-seat tool has to earn its keep across advisors and paraplanners rather than one power user, and most advisors who want terminal-class data get what they’d use from YCharts or Koyfin for a fraction of the cost.
Seeking Alpha Premium
Seeking Alpha Premium widens your funnel and shows you how other investors frame a debate. It’s a fast way to collect the bull and bear claims before you open the filings and build your own view.
The tradeoff is what you can document. Contributor quality varies, and if a conclusion depends on as-reported ratios and a storyline you can’t tie to cleaned-up drivers, compliance questions get harder, not easier.
Zacks Premium
Zacks is an ideas-first product built on earnings-estimate revisions, with screens and rating-style signals. It gives you a systematic starting universe and a consistent way to triage what to look at next.
For a fiduciary record, you’ll usually need to add clearer disclosure of inputs and an explanation of what in the financials, as-reported versus Uniform, drove the view.
Motley Fool Stock Advisor
Stock Advisor is built for individuals who want straightforward stock ideas and long-form reasoning without building their own process. It works like a curated reading list of the narratives in circulation.
It isn’t built to produce a position-level rationale tied to measured drivers, or a package you can hand to compliance without rebuilding the logic. Its published performance record, like every vendor’s, is marketing until someone independent checks it.
Where Most Platforms Fail
Platform decisions usually fail on operations rather than on research quality. Seat-based pricing balloons as you add associate advisors and try to standardize dashboards across the team. Re-entering data into CRM and portfolio accounting compounds it. A tool that exports data without a client-ready page adds hours to every review cycle.
Compliance needs an audit trail too, including the exact inputs you relied on when as-reported and Uniform earnings diverge. And don’t ignore what your custodian or broker-dealer already bundles. That package may decide the data layer even when your feature checklist says otherwise.
A Sensible Setup for a Small Firm
Aim for one tool for the client packet and another for conviction. When each tool has a clear job, you spend less time reconciling numbers and more time writing the memo.
- YCharts or Koyfin (Morningstar if your firm already provides it): screening, charts, and the meeting packet.
- One research service you can cite when as-reported and Uniform earnings diverge. Most practices leave that second seat empty, and it’s the one that decides whether the portfolio has a point of view or just a set of charts.
Decide now which tool wins when the two disagree. Until then you own a collection of subscriptions rather than a setup. The FA Alpha guide to forensic accounting explains why the Uniform view matters, and the Knowledge Base page on whether a stock is overvalued shows the test in action. For how the research is built, see the stock analysis overview.
Where the Comparison Is Less Reliable
The Kitces FinTech Map lists hundreds of tools across dozens of categories, and this comparison covers eight. The positioning is qualitative, based on each platform’s stated audience and core offering as of August 2026. Vendors add features and tiers constantly, and a practice’s existing broker-dealer bundle often decides the data tool regardless of the comparison. Test any platform against your own three hardest holdings before you commit to a year of it.
Key Takeaways
- Research platforms do one of two jobs: data and client-facing tools, or ideas and analysis. Decide which is your bottleneck before you compare prices.
- YCharts, Koyfin, Morningstar, and Bloomberg supply data and output. They don’t supply a thesis.
- Seeking Alpha, Zacks, and Motley Fool supply ideas built for individuals on as-reported numbers, which is a thin record in a fiduciary setting.
- The practical setup for a small practice is one data platform plus one research service, and the free daily is the cheapest way to test the second.
Frequently Asked Questions
What Are the Best Investment Research Platforms for Financial Advisors?
The best platform depends on which job you’re buying, client-facing data and output or ideas and analysis that hold up in review. Most firms end up with one data tool for exhibits and one research service for thesis work. Don’t let a long feature list substitute for a clean workflow.
What’s the Difference Between a Research Platform and a Research Service?
A platform organizes data and report output. A research service delivers opinions, write-ups, and a view of what matters. The difference matters when the as-reported number looks fine but the Uniform view changes the story.
Are Free or Low-Cost Stock Research Websites Enough for an RIA?
They can be enough for orientation and quick context. The limitation is auditability when you need to explain why you owned something, what changed, and which inputs you relied on. If you can’t attach the logic to a review, you’ll rebuild it in memos.
How Do You Tell If a Platform’s Fundamentals Are Cleaned Up?
Look for whether it shows the as-reported metric beside a Uniform version and explains what drove the difference. If Uniform ROA diverges from as-reported ROA, you should be able to trace the difference to specific accounting treatments. If the tool only presents a polished ratio page, you’re still doing the reconciliation yourself.
Where Is Uniform Accounting Less Reliable?
Uniform Accounting is less reliable where economic reality depends on disclosures that don’t translate cleanly into standardized adjustments, or where a company’s situation changes faster than filings capture, such as complex segment shifts, major acquisitions, and fast-moving credit events. You still need judgment, primary documents, and a clear note on what you’re assuming.
Try the Research Job Before You Pay for It
FA Alpha Daily applies this to one company, metric, or market signal every morning, free for financial advisors.