Stock Research and Valuation Frameworks for Advisors
October 21, 2026
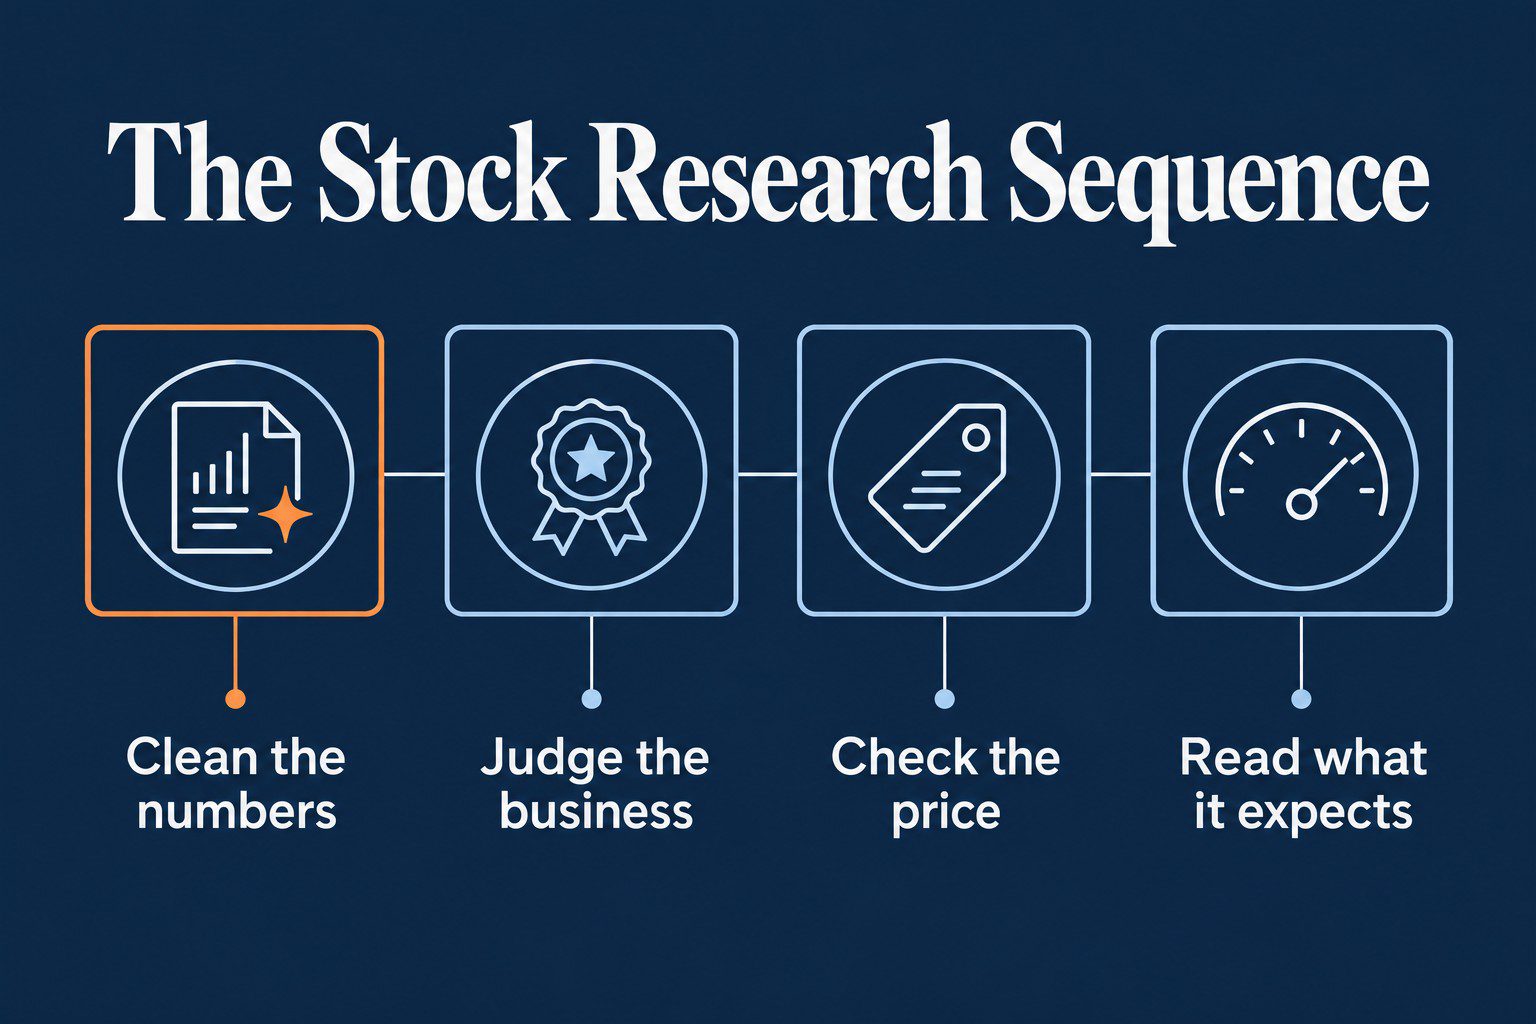
Stock research is based on a fixed order of questions. Researchers generally clean the numbers first. Next, they decide if the business is any good. Then they look at the price, and at what that price already assumes about the future.
The order matters because each step filters the next. A company whose accounts distort its returns, or whose returns stay weak once they’re cleaned up, gets dropped at the first two steps. Below, you’ll find each step plus an example of a strong business priced for decline.
Key points
- Run research in a fixed order, from cleaning the numbers to reading what the price expects.
- More than 130 Uniform adjustments stop R&D, goodwill, and leases from distorting comparisons.
- Gate every company on Uniform ROA against the corporate average and its own five-year history.
- Solve for the performance today’s price requires, then judge whether it’s plausible.
The Stock Research Sequence
More data won’t fix a shaky research process. A repeatable order of questions will, because each step protects the next one from bad inputs.
Start with price and you’re already late. Price-only screens pull you toward businesses that look safe on a multiple and are weak underneath. By the time you notice, the multiple has done your thinking for you.
The SEC’s guidance on researching investments tells investors where to find the filings. It can’t tell you whether the numbers inside are comparable from company to company. That part comes first.
| Step | What It Answers | Mistake It Prevents |
|---|---|---|
| 1. Clean the numbers | Are the inputs comparable across companies and time? | Treating as-reported ratios as facts when accounting choices moved them. |
| 2. Screen for quality | Is this a good business against the corporate average Uniform ROA? | Buying a weak business because it looks cheap on a multiple. |
| 3. Check the price | Given the quality, does the valuation deserve deeper work? | Treating a multiple as a conclusion instead of a summary of expectations. |
| 4. Read the expectations | What future Uniform ROA and growth does today’s price imply? | Defending your own forecast when the real question is whether the market’s is plausible. |
1. Clean the Numbers First
You can’t compare companies on numbers built from different choices. There’s no fraud in most of this. Management teams make permitted accounting choices, and the choices move the numbers.
R&D can be expensed against the year it was spent, which makes a reinvesting business look less profitable while it builds its advantage. Goodwill from an old deal can stay in the asset base for years and pull reported ROA down. Charges labeled one-time can repeat until they’re a run rate. Operating leases were treated differently across companies and eras.
The distortions cut both ways. Old, heavily depreciated assets can flatter as-reported ROA. A large pile of idle cash in the asset base does the opposite and buries a lean operating business.
Uniform Accounting is the answer to that. Valens Research restates each company’s financials under one rule set, applying more than 130 adjustments, so companies can be compared on the same basis. The mechanics are covered in our short answer on why GAAP earnings can distort profitability. The practical point is simpler. Every ratio you quote downstream is only as good as these inputs.
2. Screen Quality Before Price
Judge the business before you argue about its price. Uniform return on assets (“ROA”) is the gate. The corporate average Uniform ROA is the bar, a convention used across all of our research. Compare a company against that average and against its own five-year history.
A high Uniform ROA that holds up over the years is evidence of a competitive advantage that’s holding too. A weak one, forgiven because the multiple looked cheap, is how value traps get into portfolios. There’s a full piece on finding undervalued stocks without falling for value traps.
Durability gets checked here too, and that’s where earnings quality comes in. You’re checking whether the returns are durable, because valuation work on fading returns turns into explaining weak economics to a client later. The FA Alpha 50 comes from this same order of operations, run across the whole market every month.
3. Check the Price
Use the price to decide what deserves deeper work. Once a company clears the quality gate, look at its Uniform P/E. A multiple bundles expectations for growth and risk, so a low one isn’t automatically a gift. Two companies can post the same Uniform ROA, and the one with a shorter reinvestment runway should trade cheaper. That discount can be rational.
Trouble starts when the multiple becomes the conclusion. Write one line in the research memo. What has to be true for this Uniform P/E to make sense? If you can’t name the one or two causes, the number is doing your thinking. Our short answer on whether a stock is overvalued applies the same test.
4. Read What the Price Expects
The last step turns valuation into an audit of the price. We can see this through Valens’ Embedded Expectations Analysis (“EEA”) framework. The EEA starts by looking at a company’s current stock price. From there, we can calculate what the market expects from the company’s future cash flows. In other words, the EEA shows how well a company has to perform in the future to be worth what the market is paying for it today.
A forecast-first DCF asks you to defend your own inputs every time the stock moves. With the EEA, the market supplies the inputs, and your job is to judge whether they’re plausible against the company’s own Uniform history.
Market-level multiples deserve the same treatment. The Shiller PE tells you where the whole market sits, and it’s context rather than a signal. It’s also computed on reported earnings, so it inherits the same distortions the first step cleans up.
Example: Strong Business, Priced for Decline
Example Co. reports ROA of 6%, roughly flat for five years. On a screen it looks below average, and the market prices it that way.
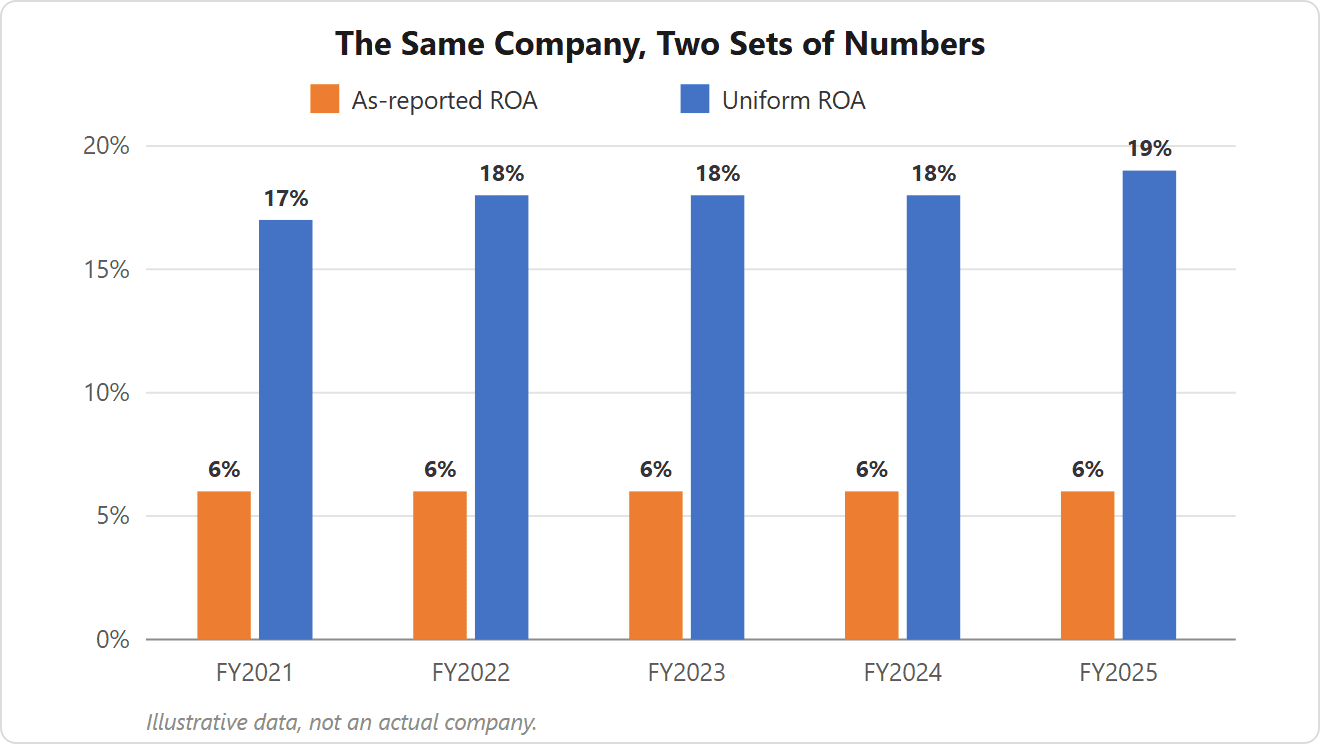
Under Uniform Accounting the picture reverses. Take out the goodwill from an old acquisition, treat the R&D consistently, and Uniform ROA comes in at 18%, well above the corporate average. It has held that level for five years.
Now the price. At today’s stock price, the embedded expectation is Uniform ROA fading to 8% by 2030, well below the five-year average of 18%.
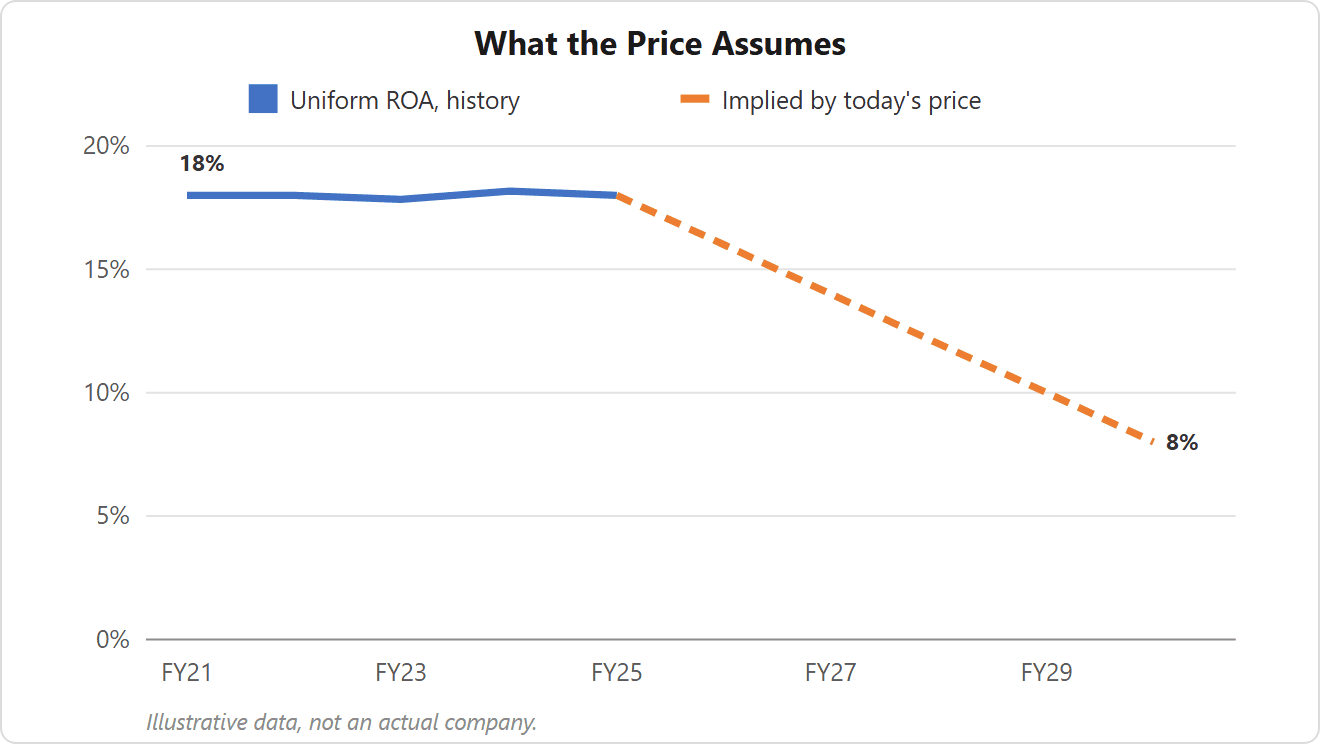
The as-reported view says average business, fully priced. The Uniform view says strong business, priced for decline. Example Co. is an illustrative company, and the numbers are made up.
The memo writes itself from there. State both ROAs, state the path the price assumes, and decide which one you’re underwriting.
What You Can Say to Clients
These conversations go better with plain language than with a model review. A few lines that tie business quality to what the price assumes will hold up in real time.
When a Client Brings You a Low P/E Stock
“Low P/E is a starting point, not a reason to buy.”
“We check whether it’s a strong business on clean numbers first, because plenty of cheap-looking stocks are cheap for a reason.”
When a Holding Looks Expensive in the Headlines
“Headline multiples run on reported earnings, and reported earnings reflect accounting choices. On a comparable basis, this company’s returns look very different.”
“The price already assumes something about the future. We think the returns can hold up better than what’s priced in, and that’s reasoning we can show you.”
When a Client Asks What the Position Depends On
“We’re not trying to guess next quarter. We’re judging whether the performance the price requires is reasonable.”
“That question has an answer we can revisit as the returns come in.”
Key takeaways
- Clean the numbers first, because every ratio downstream inherits its inputs.
- Gate on quality with Uniform ROA against the corporate average before debating price.
- Treat a Uniform P/E as a summary of expectations, and write down what has to be true.
- Finish by judging the path today’s price implies, compared with the company’s Uniform history.
Frequently Asked Questions
What is a stock valuation framework?
It’s the set order of questions you use to connect business performance to price. The order shows clients and compliance what you checked and why. Done well, it turns valuation from a forecast debate into a test of what has to be true.
How do professional analysts research stocks?
The path is repeatable. Clean and normalize the financials, judge business quality over time, then translate the current price into the performance it implies and compare that with history. The output is a short memo stating the key numbers and what would prove the thesis wrong.
What is Embedded Expectations Analysis?
It starts with today’s stock price and solves for the future performance that price implies. That translates valuation into plain language, such as the returns the market needs the company to deliver. Your job becomes judging plausibility instead of defending a forecast.
What is Uniform Accounting?
It’s a standardized restatement of financial statements, applying more than 130 adjustments so companies can be compared on the same basis. It reduces the noise from permitted reporting choices that distort earnings and asset bases. Uniform ROA and Uniform P/E are computed on that consistent foundation.
The same framework, applied every morning
FA Alpha Daily applies this to one company, metric, or market signal every morning, free for financial advisors.