
Retirement Income Planning: The Rules and the Return
October 23, 2026
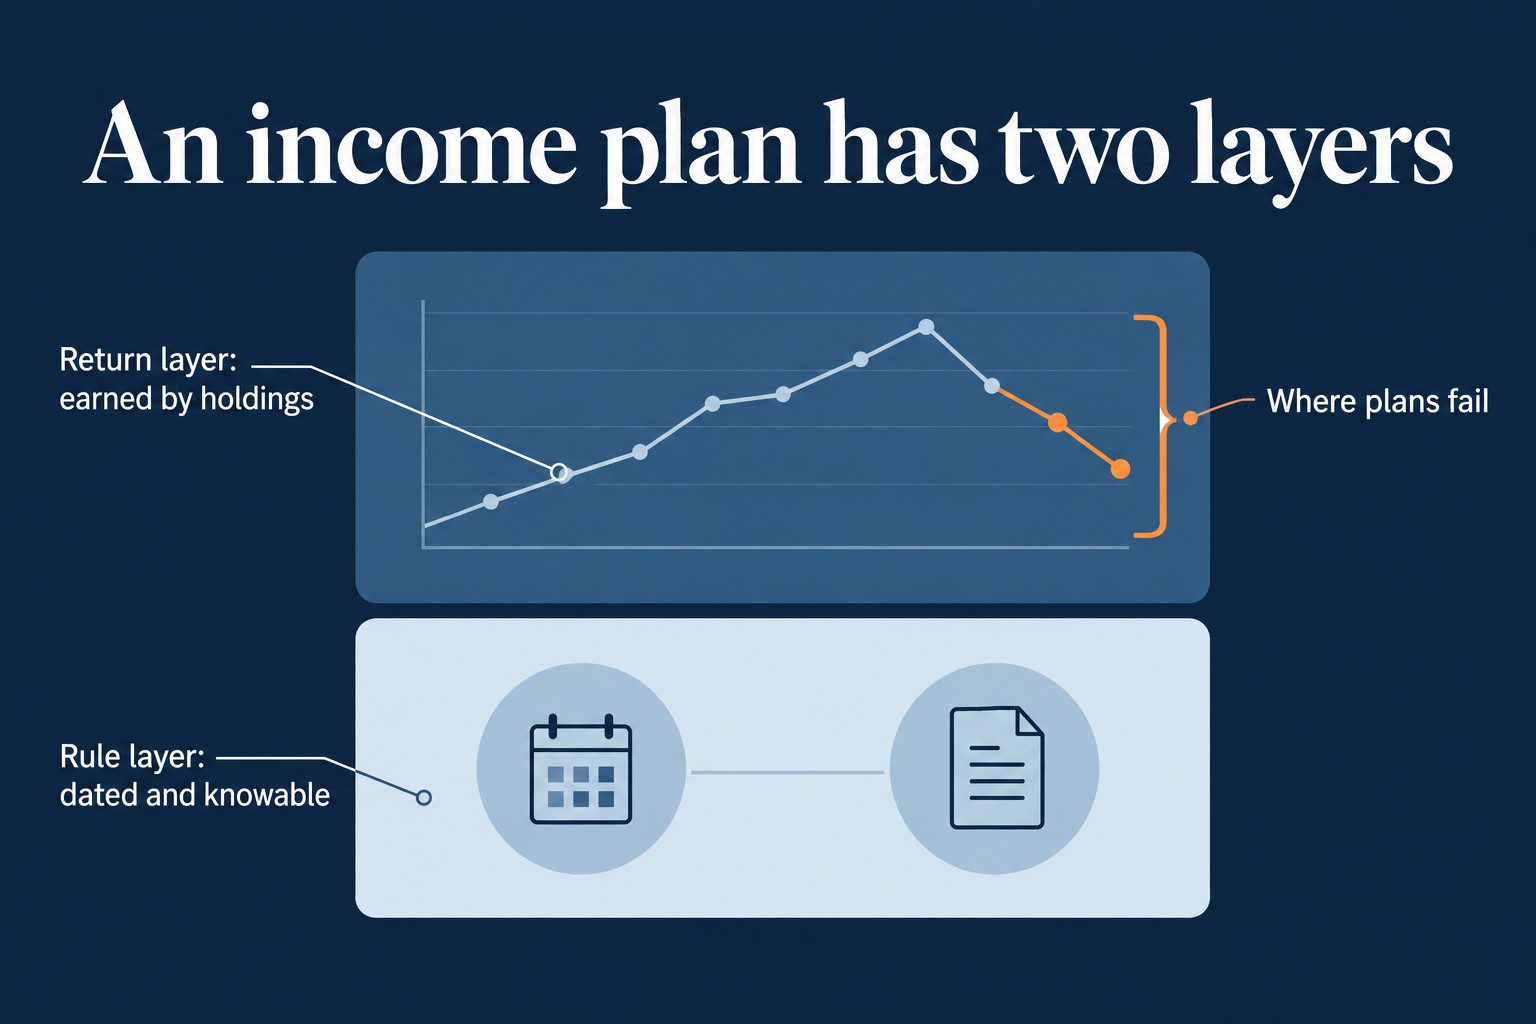
Retirement income planning has two layers. One is the rules, which you can look up. The other is the return, which the portfolio has to earn, holding by holding.
Most advisors can document the rule layer because it’s dated, knowable, and auditable. The plan tends to fail on the return layer, because withdrawal conventions and conversion payoffs assume a portfolio result that doesn’t arrive automatically.
Key points
- A missed RMD carries a 25% excise tax, and the $25,000 Social Security threshold was never indexed.
- Bengen’s 4% rule describes what a stock-heavy portfolio returned, and he now cites 4.7%.
- Judge dividend durability by setting Uniform cash flows against debt maturities and interest.
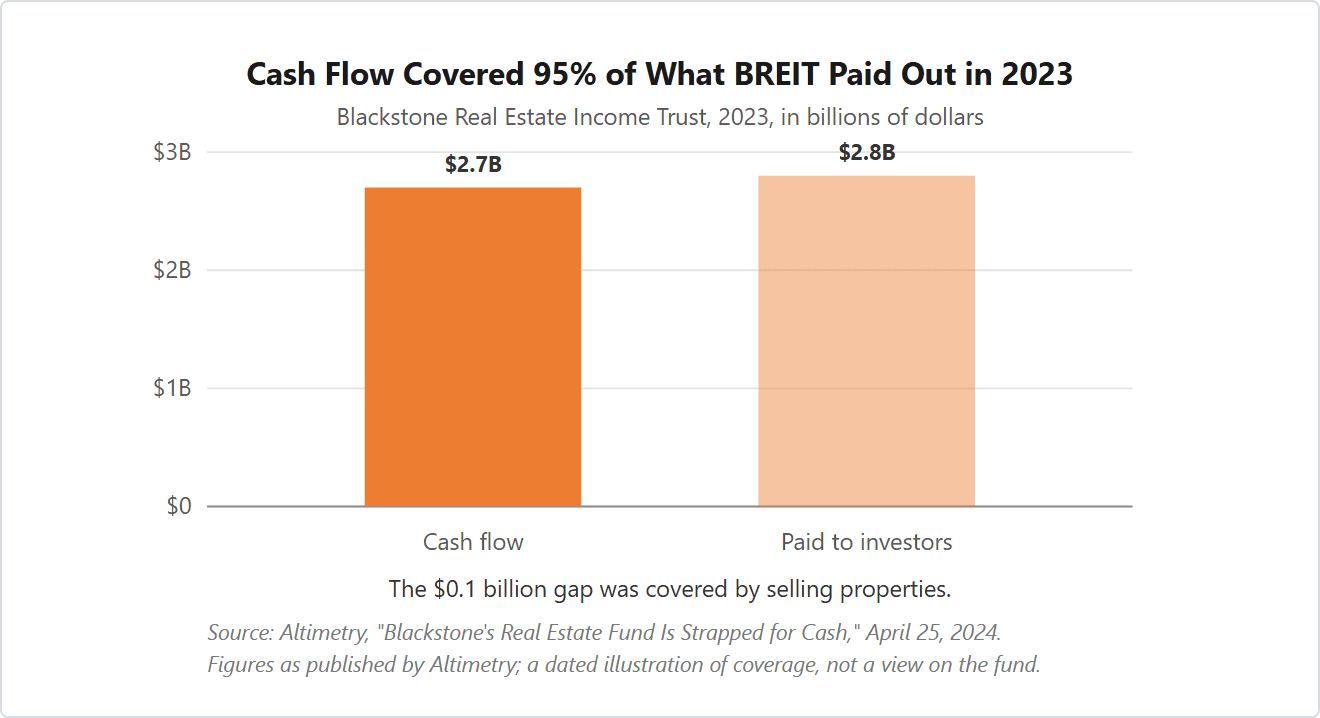
- BREIT generated $2.7 billion of cash flow in 2023 against $2.8 billion paid out.
Which 2026 Rules Matter?
A single missed date can turn a clean income plan into an excise tax bill.
Required Minimum Distributions
RMDs start at 73. The owner can delay the first one until April 1 of the following year, and later ones are due by December 31. A missed RMD carries an excise tax of 25%, reduced to 10% if corrected within two years. Roth IRAs and designated Roth accounts have no lifetime RMDs for the owner.
The age moves to 75 for anyone born in 1960 or later under the final regulations. The question for each client is which accounts have an RMD due, and which don’t.
Social Security Taxes
Social Security becomes taxable once combined income passes $25,000 single or $32,000 joint, with up to 85% of benefits included above $34,000 and $44,000. Congress set those thresholds in 1983 and 1993 and never indexed them. The question is which of this year’s withdrawals push combined income across a line that hasn’t moved in decades.
Medicare Part B Premiums
Medicare Part B costs $202.90 a month in 2026 at the standard premium. It steps up above $109,000 of income for an individual or $218,000 for a couple, and reaches $689.90 at $500,000 or $750,000 and up. The determination uses the tax return from two years earlier, so the question is which 2026 decision, a conversion or a large sale, sets the 2028 premium.
The Senior Deduction
For 2025 through 2028, a taxpayer 65 or older gets an additional $6,000 deduction per person, or $12,000 for a qualifying couple, itemizing or not. It phases out above modified AGI of $75,000, or $150,000 joint. The question is which side of the phaseout line this year’s income plan leaves the client on.
The 4% Rule
The 4% rule is a historical return test that gets read as a spending rule. In his 1994 paper, William Bengen wrote that “a first-year withdrawal of 4 percent, followed by inflation-adjusted withdrawals in subsequent years, should be safe.” He added that “in no past case has it caused a portfolio to be exhausted before 33 years.” Those sentences describe what happened in his dataset, with his portfolio construction.
Bengen also told planners to keep stocks “as close to 75 percent as possible, and in no cases less than 50 percent.” That stock weight matters. The withdrawal convention describes what a majority-stock portfolio returned across history, wearing a spending label. Filing the 4% figure with the rules, as something you look up once, leaves the biggest variable in the plan unexamined.
Bengen has since updated his numbers. On his site, he says his later research “has morphed into the ‘4.7% Rule.'”
The Return Layer
The return is the specific companies and funds you own. It depends on the dividends and interest you’re counting on still arriving after their cash covers everything else first.
Payout ratios based on as-reported earnings can’t tell you that. The ratio divides a cash dividend by an accounting earnings number, and that number varies across companies because GAAP and IFRS allow different treatments that make the income statement and balance sheet less comparable than they look. Careful work on RMD timing and tax sequencing doesn’t protect an income portfolio whose distributions depended on earnings that never existed as cash.
Judging Dividend Durability
Uniform Accounting makes the comparison usable by applying over 130 adjustments to the as-reported statements so you can evaluate companies on one basis.
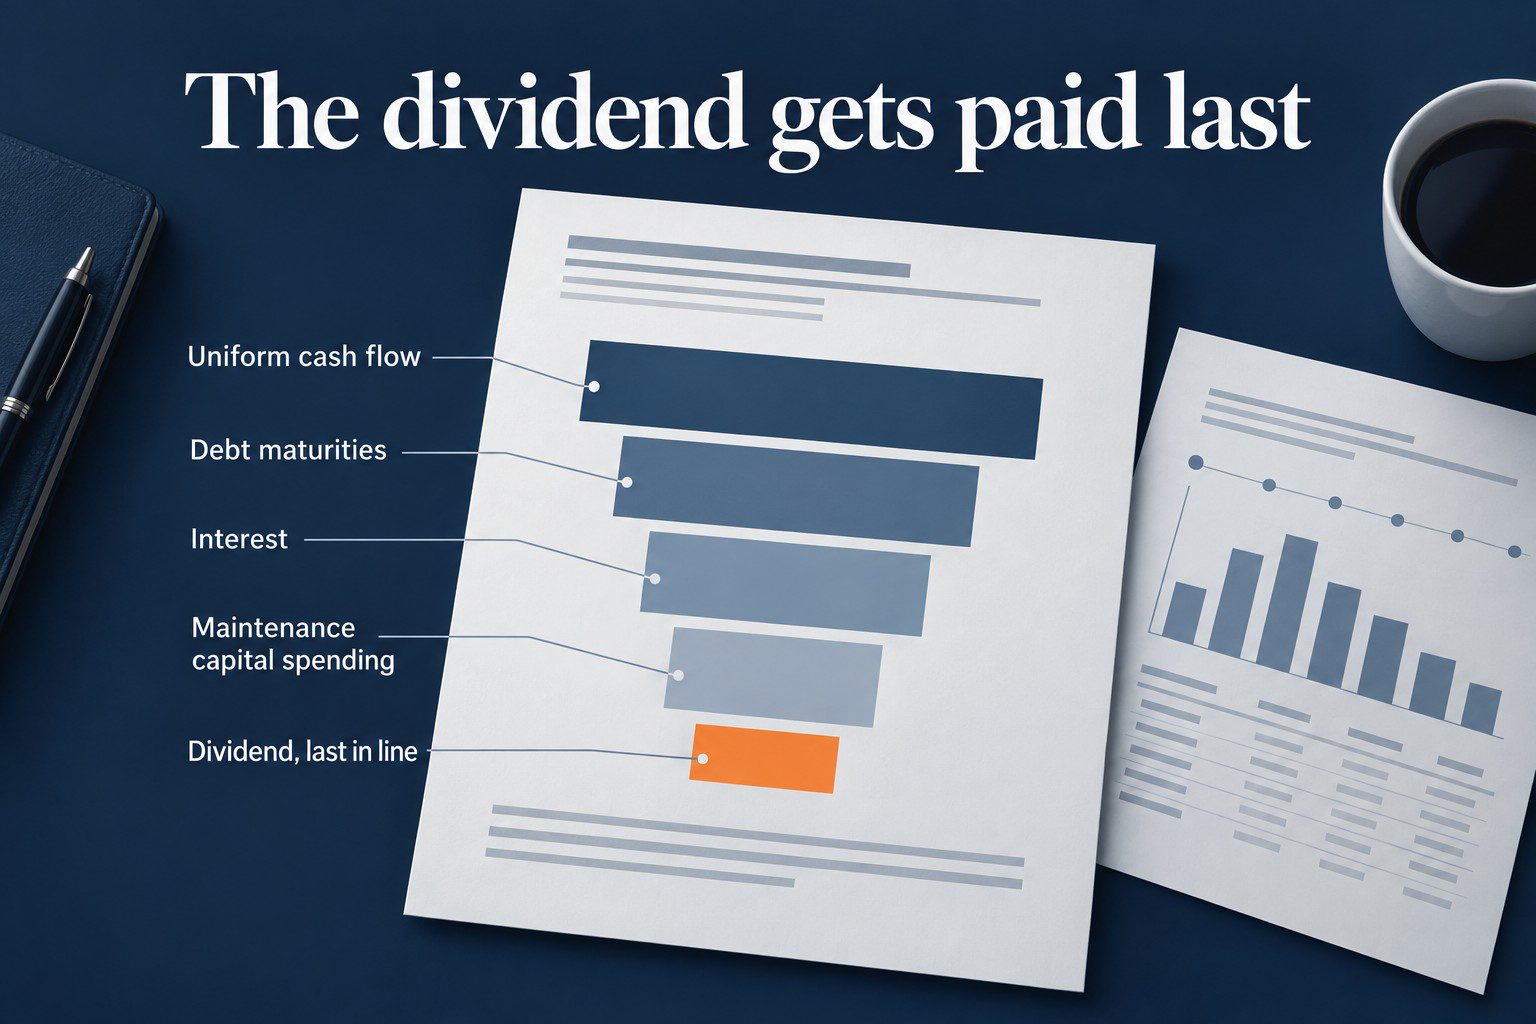
Then you judge dividend durability the way a forensic accountant would. Put the company’s Uniform cash flows against its hard obligations, meaning debt maturities, interest, and maintenance capital spending. Only then ask what’s left for the dividend. Cash pays the dividend, as the cash flow statement makes plain.
The order is the method.
- Uniform cash flows
- Debt maturities
- Interest
- Maintenance capital spending
- Dividend, only after the above clear
If the plan counts the dividend as a senior claim, the portfolio can look stable right up to the quarter it isn’t.
Do the same for the return layer by documenting one thing for each income holding. Does expected cash generation cover hard obligations first and the dividend last? When your process can’t answer that in a sentence, you’re still relying on the rule layer to solve a return-layer problem.
Examples
Blackstone Real Estate Income Trust (BREIT) generated $2.7 billion of cash flow in 2023 against $2.8 billion paid out. Cash flow “only covered 95% of its payouts,” so the fund “had to sell some of its properties to cover the rest.”
In September 2024, Blackstone Mortgage Trust had cut its dividend from 62 cents to 47 cents a share, a 24% reduction that saved about $100 million a year. Altimetry then published its obligations view, which found that “in 2025 and 2027, it won’t be able to pay dividends.” That was Altimetry’s published finding at the time.
And in May 2024, Altimetry described Thomson Reuters paying nearly $1 billion a year in dividends with about $1 billion of debt due in 2025 and about $1 billion of free cash that year. It concluded that “starting in 2025, it’s going to need to save all its cash just to pay its existing bills.”
Screening for yield selects the same kind of trap as screening for a cheap P/E. The market marks the price down before the company cuts the dividend, so a high yield is a price signal as much as an income signal. Sort by yield and you should be ready to explain why the market is wrong, not just why the payout ratio looks fine. That is the same test you’d run on any undervalued stock.
How to Use the Two Layers
Run the two layers as two separate jobs. Check the rule layer once a year with that year’s numbers, and write down the one question each rule raises for the client that year.
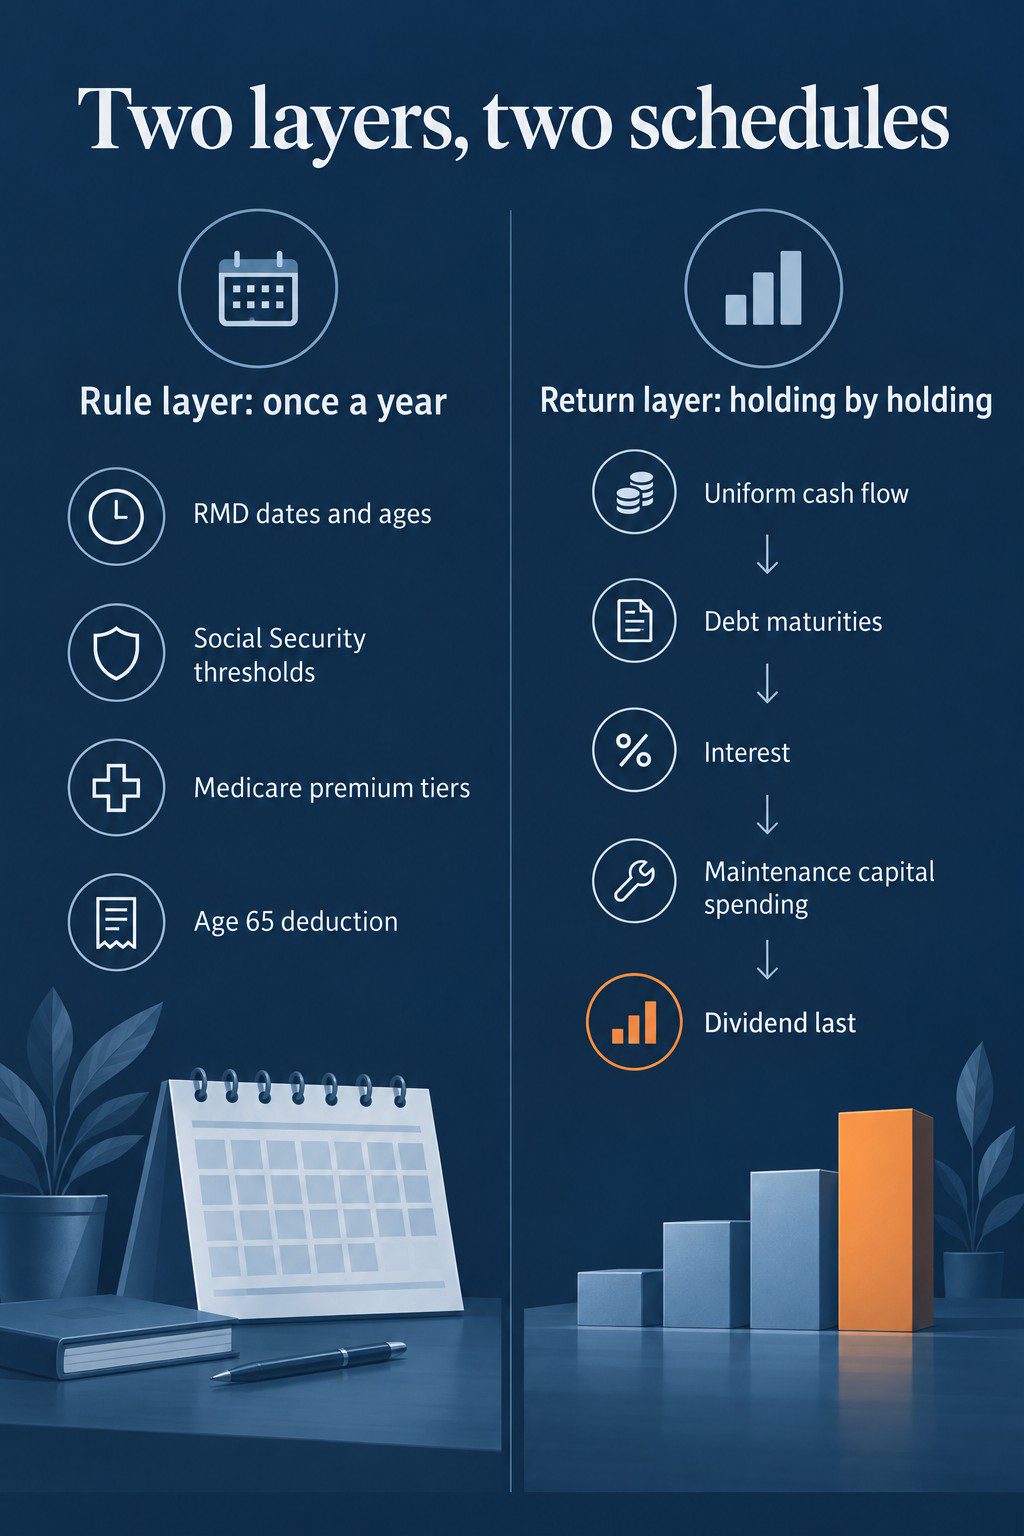
The return layer is ongoing portfolio research. Check income holdings one by one by stacking Uniform cash flows against hard obligations and debt maturities, and count the dividend last. Doing that across every holding in every client plan becomes a data job, which is the job the research platforms are built for.
Key takeaways
- Check the rule layer once a year, including RMD dates, the unindexed Social Security thresholds, the two-year Medicare lookback, and the senior deduction phaseout.
- The 4% rule describes what a stock-heavy portfolio returned, so the plan’s biggest variable is the return the holdings deliver.
- Judge each income holding by setting Uniform cash flows against debt maturities, interest, and maintenance capital spending, and count the dividend last.
- A high yield is a price signal as much as an income signal, so treat it as a reason to run the coverage check.
Frequently Asked Questions
Does the Rule Layer Still Matter?
Yes. The IRS and Medicare thresholds are dated and knowable, and a missed one costs real money. Getting the dates right doesn’t make the portfolio earn its return.
What Counts as a Hard Obligation?
The bills a company has to pay before it can choose to pay a dividend are its debt maturities, interest, and maintenance capital spending. If cash can’t clear those first, the dividend is a lower-priority use of cash.
Why Isn’t the Payout Ratio Enough?
The payout ratio compares a cash dividend to as-reported earnings, and as-reported earnings vary across companies because accounting standards allow different treatments. You can see coverage on paper while the cash gets spoken for somewhere else.
Does Screening for Yield Still Work for Retirement Income?
A high yield is also a price signal, and the market usually marks a price down for a reason. Sorting by yield selects for companies where you should be ready to explain why the cash can keep supporting the distribution.
One Company, Every Morning
FA Alpha Daily applies this to one company, metric, or market signal every morning, free for financial advisors.