
P/E Ratio
October 28, 2026
A P/E ratio is the share price divided by twelve months of earnings per share, either the last twelve months as reported or the next twelve as analysts estimate them. It tells you what the market pays for a dollar of earnings. What it means depends on what that dollar of earnings is made of, so read the earnings figure before you judge the multiple.
The explainers on page one show the division and stop. This page reads the earnings.
Key points
- Know whether a P/E is trailing or forward, because multiples on different earnings don’t compare.
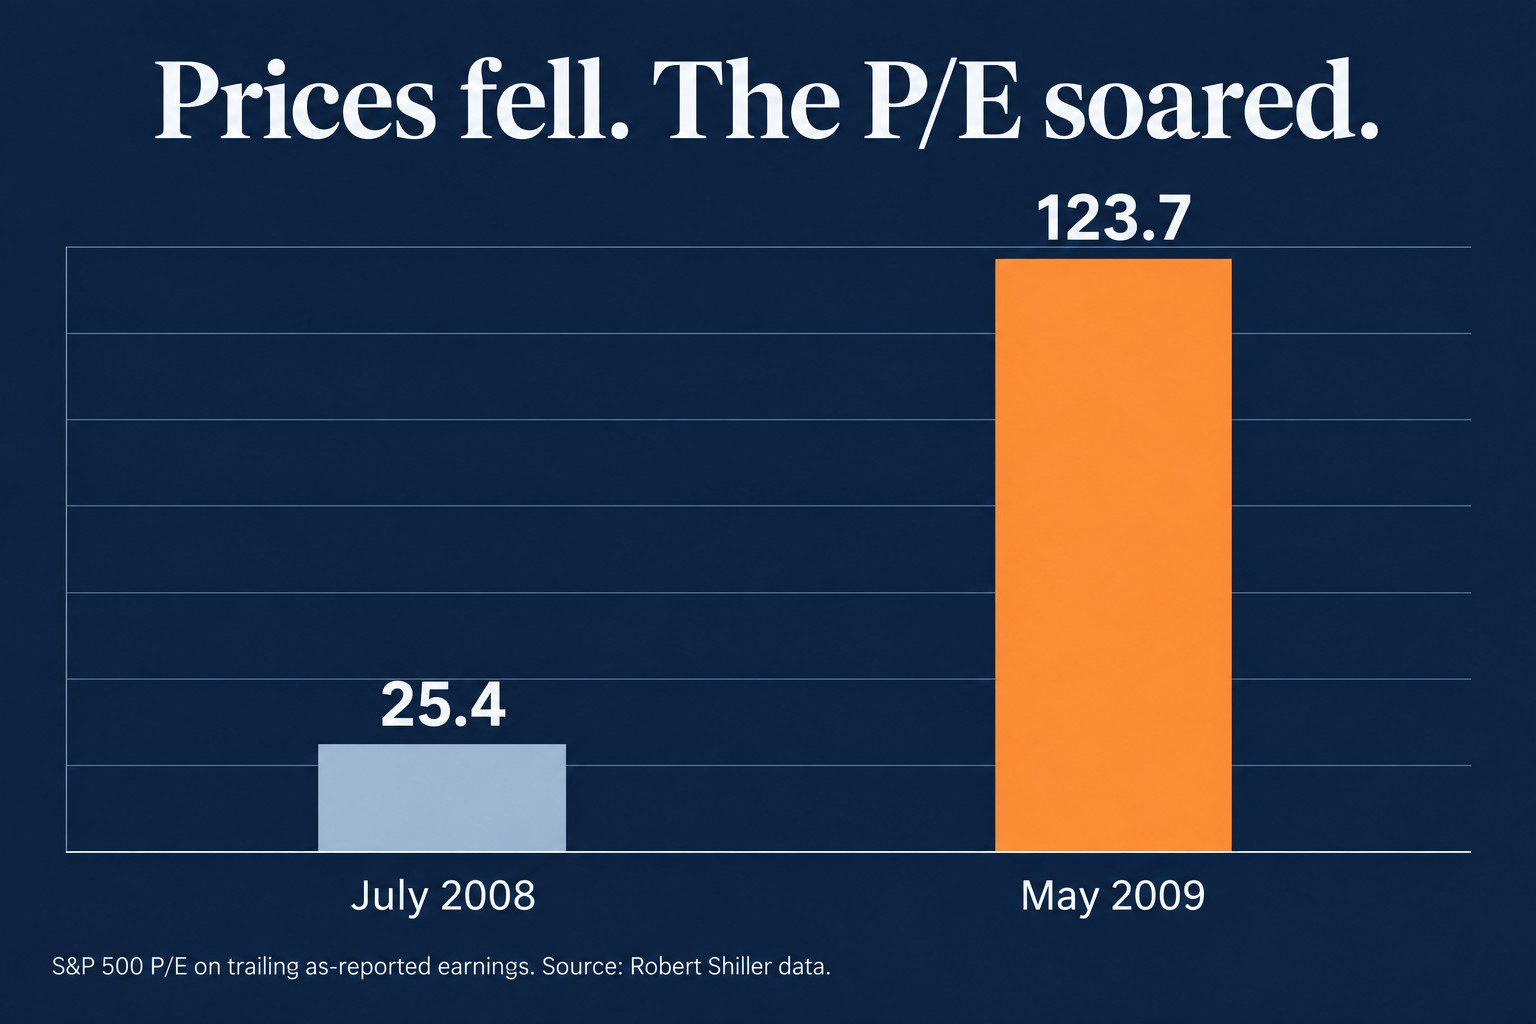
- The S&P 500’s as-reported P/E hit 123.7 in May 2009 because write-offs nearly erased earnings.
- In April 2020, Kraft Heinz looked cheap on its as-reported P/E and sat at the market average on its Uniform P/E.
- In August 2026 Shiller’s as-reported series read 26.1, and the market’s Uniform P/E sat several points lower.
- Ask which earnings, why the multiple sits there, and compared with what before judging a P/E.
What Is a P/E Ratio?
The SEC’s Investor.gov glossary puts it in one line. The ratio “is calculated by dividing the current stock price by the current earnings per share.” Earnings per share, it adds, “are calculated by dividing the earnings for the past 12 months by the number of common shares outstanding.”
A trailing P/E divides the price by the last 12 months of reported earnings per share. A forward P/E divides it by the next 12 months of analyst estimates. Two multiples built on different earnings figures can’t be compared, so know which one you’re looking at.
One limit comes from the division itself. If earnings are zero or negative, the ratio tells you nothing.
What Makes a P/E Ratio High or Low?
A P/E ratio moves for three reasons. The first is what the market expects earnings to do next. A stock at 26 times reported earnings is priced for more growth than one at 12 times. The second is the return investors require for the risk, which moves with rates, the business, and the balance sheet.
The third is the earnings figure itself. The explainers take it as a fact. It’s an accounting result, and it moves with write-offs, one-time items, and choices you only catch by reading the statements the way a forensic accountant does. Before you label a multiple high or low, decide which of the three is doing the work.
Why Did the S&P 500 P/E Hit 123 in 2009?
The plainest case of the earnings figure driving the multiple is the whole market in 2009. Robert Shiller’s series of the S&P 500 price divided by trailing twelve-month as-reported earnings, published by multpl, read 25.4 on July 1, 2008. It read 110.4 on March 1, 2009. On May 1, 2009 it reached 123.7, the highest reading in the whole series.
Prices were near their lows that spring. The ratio read expensive anyway. Reported earnings had collapsed under write-offs and losses, so the denominator nearly vanished. By December 1, 2009 the same series was back to 21.8, and by December 1, 2010 it was 16.1.
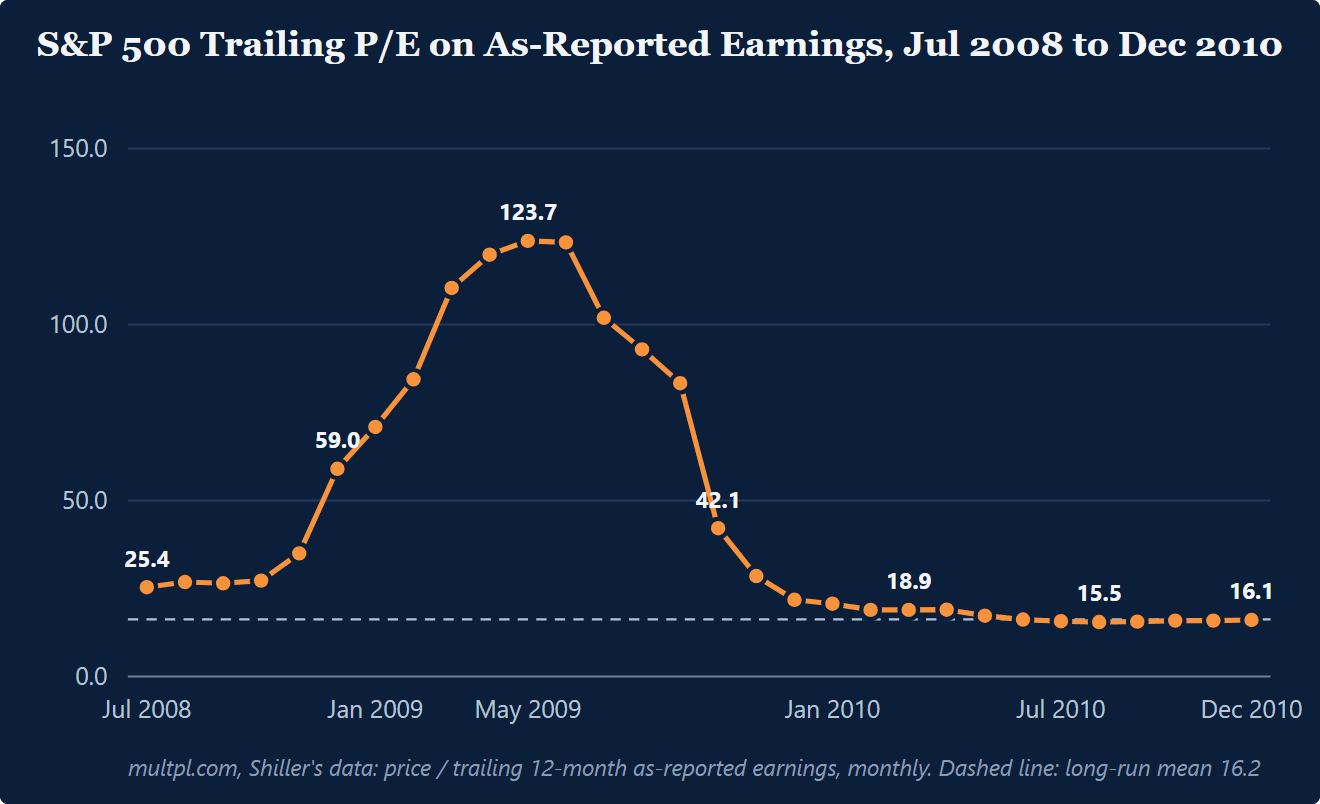
Ask the same question of every high multiple. Did the price rise, or did the earnings fall? The Shiller PE divides by ten years of the same as-reported earnings, which smooths the cycle and leaves the accounting where it was.
What Happens When As-Reported and Uniform P/E Disagree?
Uniform Accounting puts every company’s earnings on one basis before you divide the price by them. Valens applies more than 130 adjustments to the reported statements, for research spending, operating leases, stock options, goodwill, and one-time items. The Knowledge Base page on why GAAP earnings distort profitability walks through the patterns, and the earnings quality checks test if a reported figure describes the business at all. A Uniform P/E is the price divided by the earnings after those adjustments.
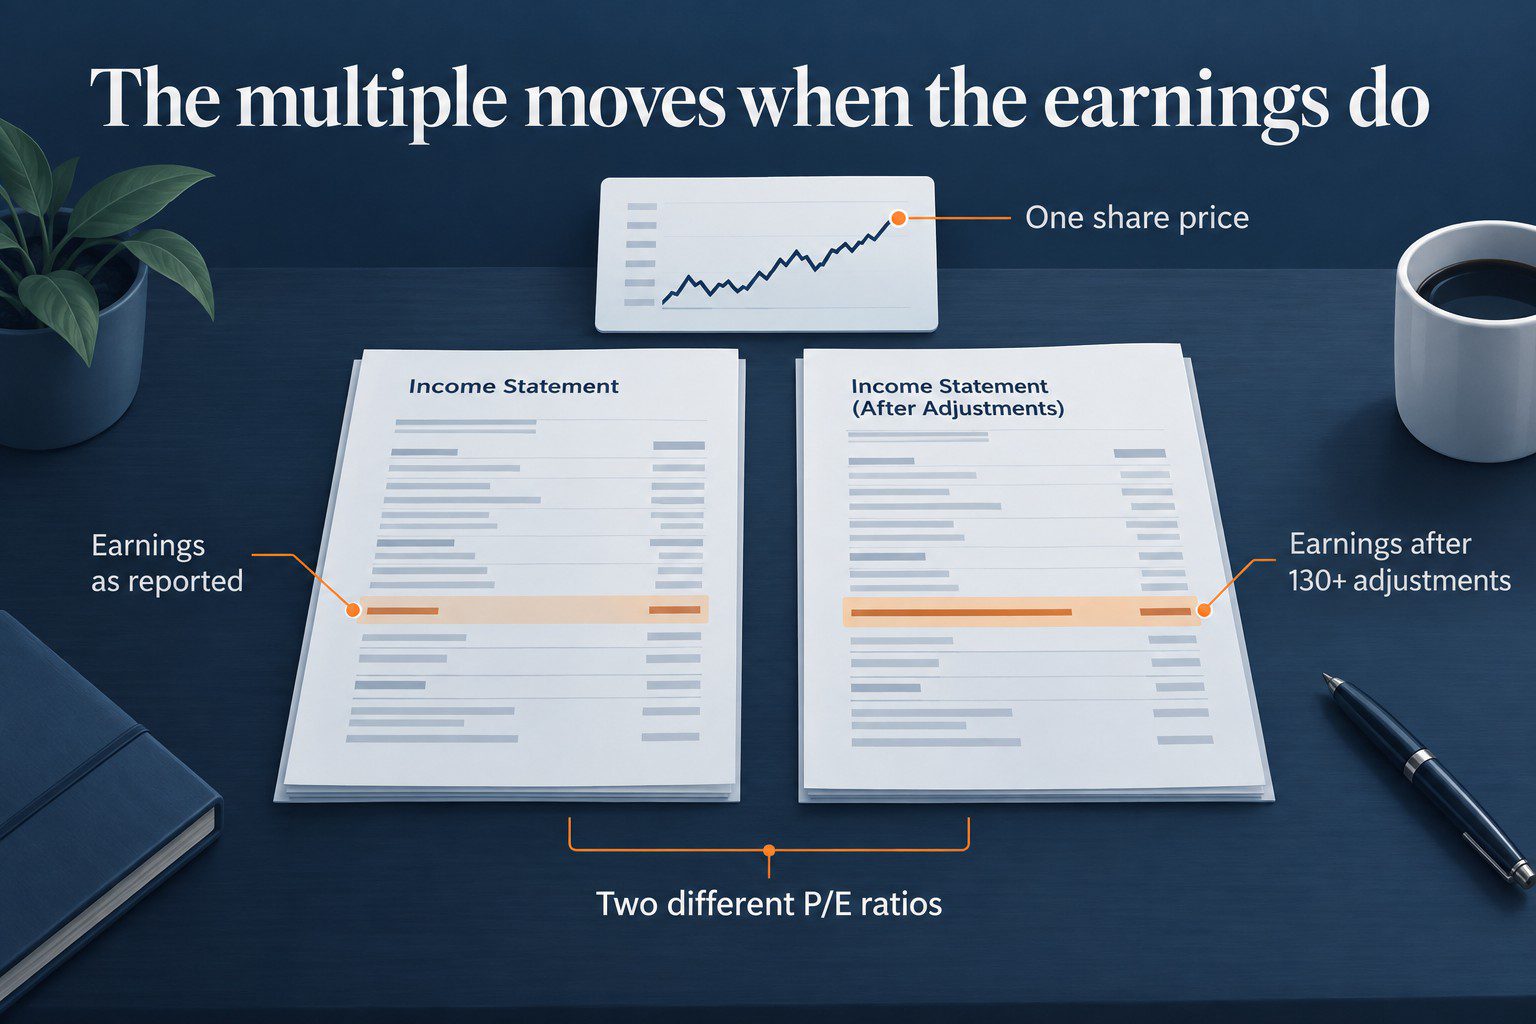
Altimetry’s April 3, 2020 reading on Kraft Heinz found it cheap on its as-reported P/E and “right at market averages” on its Uniform P/E. Its as-reported return on assets was low, while its Uniform return on assets (“ROA”) ran many times higher. A stock that looked cheap for a poor business was an average price for a good one.
Altimetry’s September 15, 2022 reading on General Mills ran the other way. The as-reported P/E was below the market average, and the Uniform P/E was above it. As-reported ROA had been modest since 2018, while Uniform ROA had run several times higher. A stock that looked below average was above it.
Altimetry’s April 30, 2020 reading on Accenture showed an as-reported P/E above the market average, and a Uniform P/E below it. Its Uniform ROA had run several times its as-reported ROA. A stock that looked expensive was below average on comparable earnings.
The chart shows the same three patterns on example figures. These are example figures, not data for any company. A packaged food company trades at 11 times as-reported earnings and 18 times Uniform earnings. A cereal maker trades at 18 and 25. A consulting firm trades at 24 and 17.
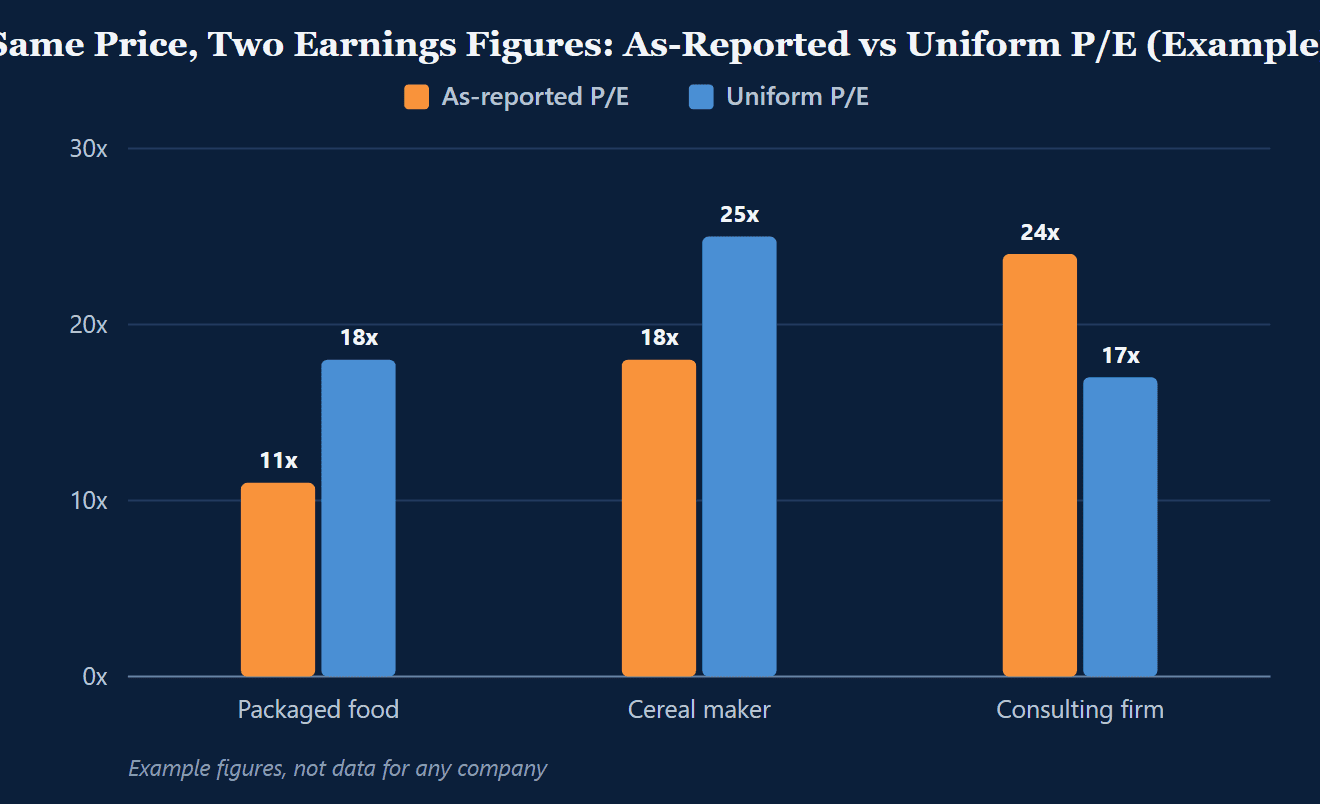
In all three the price was the same. The earnings figure gave the opposite answer. These are dated readings, and none of them is a view on any of the three today.
Which P/E Does the Market Trade At?
There is no single market P/E. There are two, and they differ by the earnings they divide by. Valens’ Market Phase Cycle Monitor for August 2026, dated August 20, put the market’s Uniform P/E several points below the as-reported reading, and lower than at year-end 2025. Uniform earnings grew modestly in 2025, and Wall Street expected much faster growth across 2026 and 2027. In a market with growth that strong, Valens wrote, higher P/Es are warranted.
Take an example to see the size of that gap. These are example figures, not data for any company. A market trades at 26 times as-reported earnings and 20 times Uniform earnings.
Shiller’s as-reported series on multpl read 28.5 on December 1, 2025 and 26.1 on August 1, 2026. Same market, same months, several points apart from the Uniform reading, and nothing changed except the earnings figure. FA Alpha Pulse publishes the market’s Uniform P/E and the Market Phase Cycle reading every month.
How Do You Read a P/E Ratio With a Client?
Three questions settle most of it.
- Which earnings: Trailing or forward, as-reported or Uniform. A stock’s as-reported trailing multiple can’t be compared with the market’s Uniform P/E or with a forward estimate.
- Why it is where it is: The market expects growth, the market wants a higher return, or the earnings figure moved. For a high multiple, ask if the price rose or the earnings fell.
- Compared with what: The market’s multiple on the same earnings basis, and the company’s own history. If the multiple still looks wrong after those three, the next step is the screen for undervalued stocks.
A P/E ratio also tells you little about a bank or an insurer, whose balance sheet is mostly financial instruments, or about a company with no earnings to divide by.
FA Alpha Daily applies this to one company, metric, or market signal every morning, free for financial advisors. Get FA Alpha Daily.
Frequently Asked Questions
What Is a Good P/E Ratio?
There isn’t a universal good P/E ratio, because the number only means something against a baseline. Altimetry has measured stocks against the market average in dated readings, such as April 2020 and September 2022. Each is a dated reading, and it depends on which earnings figure the multiple divides by.
What Does a High P/E Ratio Mean?
A high P/E ratio can mean the market expects faster earnings growth, or it can mean the earnings figure collapsed. Ask if the price rose or the earnings fell before calling it expensive.
What Is the Difference Between Trailing and Forward P/E?
A trailing P/E divides the price by the last 12 months of reported earnings per share. A forward P/E divides it by the next 12 months of analyst estimates, which changes the denominator but doesn’t change what’s inside the earnings.
Why Was the S&P 500 P/E Over 100 in 2009?
Reported earnings collapsed under write-offs and losses while prices were near their lows, so the denominator nearly vanished. On Shiller’s as-reported series the trailing P/E reached 123.7 in May 2009 and was back to 21.8 by December 2009.