S&P 500 Dividend Returns: Where Did the Yield Go?
November 6, 2026
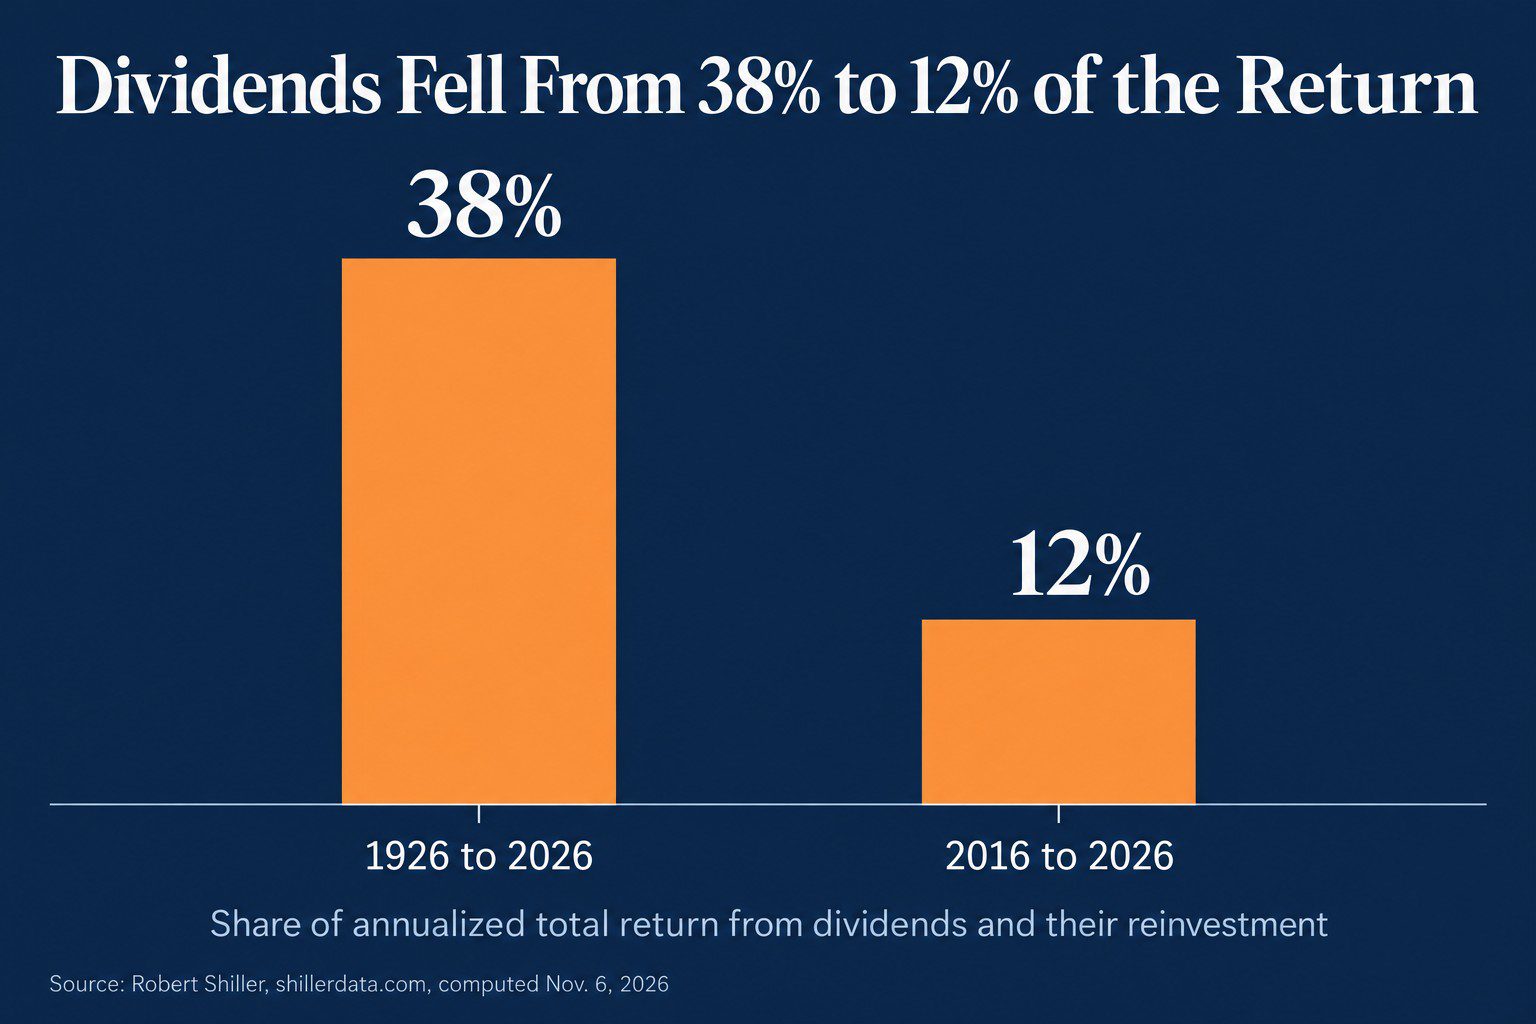
From 1926 to 2026, dividends and their reinvestment made up about 38% of the S&P 500’s total return, using Shiller’s data. Today, the index dividend yield is about 1.10% (May and June 2026), matching the August 2000 low in the same series. Does that mean dividends stopped mattering? No. It means most of the cash now leaves these companies another way, and the yield can’t see it.
A few months before a client retires, the portfolio’s job switches from growth to paying the bills, and both of those numbers get a closer look. Both are true. Nobody can say what the next decade’s share will be. The last one we can explain. The dividend’s share of the return has fallen for decades, and the yield fell even as the dividend dollars rose.
Key points
- Dividends were about 38% of the S&P 500’s return since 1926 and 12% of it since 2016.
- The yield fell to 1.10% because prices outran dividends, which still grew about 6% a year.
- Buybacks took $1.020 trillion of the cash returned in a year, against $664.9 billion of dividends.
- AbbVie’s dividend is 280% of as-reported EPS and 45% of Uniform EPS, so a payout screen misreads it.
- Three checks are worth more than the yield, starting with earnings measured on one basis.
How Much of the Return Came from Dividends
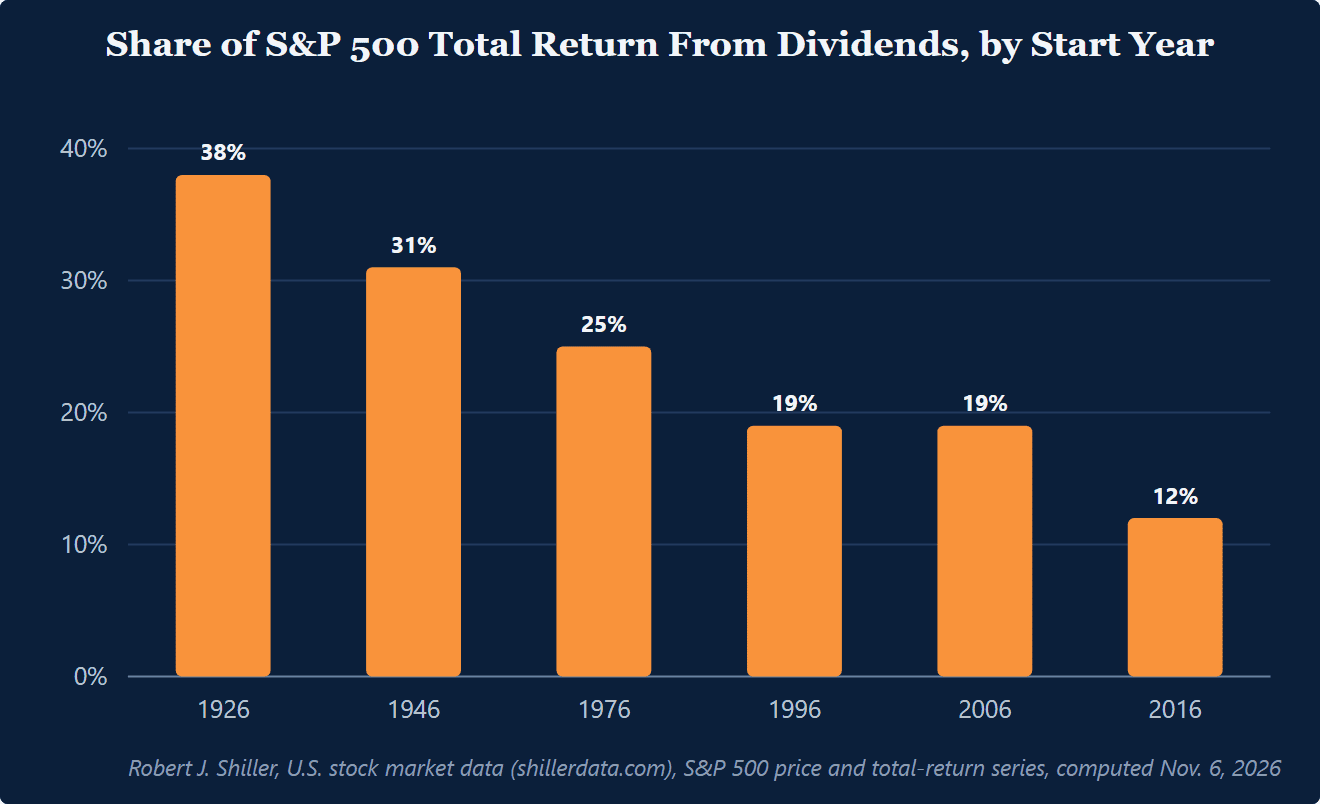
Nobody needs an opinion on dividends here. A century of prices and payouts answers the question. Using Shiller’s data and comparing January to January, the S&P 500 compounded at 10.4% a year from 1926 to 2026 with dividends reinvested, against 6.5% a year on price alone. So about 3.9 points a year came from dividends and their reinvestment, roughly 38% of the total.
The later the start date, the smaller the dividend’s share. From 1976 to 2026, Shiller’s series shows 11.8% total return against 8.9% on price, so dividends and reinvestment were about 25% of the total. From 1996 to 2026, it’s 10.4% against 8.4%, about 19%. From 2016 to 2026, it’s 15.6% against 13.7%, so only about 12% of the total came from dividends.
Hartford Funds’ 2026 edition of “The Power of Dividends” (data through 12/31/25, sourced to Morningstar) uses different windows and reaches a similar place. From 1940 to 2025, dividend income averaged 33% of the index’s total return. By decade the swing is wide. Dividends were 67% of the return in the 1940s, 73% in the 1970s, 16% in the 1990s, and 12% in the 2020s. The 2000s don’t fit the table, because the decade’s total return was negative even though dividends added 1.8% a year. Hartford puts a dollar figure on the compounding. $10,000 put into the index in 1960 grew to about $7.58 million by the end of 2025 with dividends reinvested, and to about $1.14 million on price alone. A plan that assumes dividends will be a third of the return and a plan that assumes 12% aren’t the same plan, so decide which period the plan is borrowing from.
Why the Index Yield Fell
The yield is low because prices outran dividends, not because companies stopped paying them. In May and June 2026, Shiller’s data shows a 1.10% dividend yield, matching the August 2000 low in a series that runs back to 1871. At the start of each decade the same series shows how far the yield has drifted. It was 5.1% in January 1980, 3.3% in 1990, 1.2% in 2000, 2.0% in 2010, 1.8% in 2020, and 1.15% in January 2026.
The dividend dollars still grew. Shiller’s trailing dividends per share rose from $43.55 in January 2016 to $79.80 in January 2026, about 6.2% a year, and from $13.89 in January 1996, about 6.0% a year over thirty years. One more check is the earnings yield. In June 2026 it was 3.96%, against the 1.10% dividend yield, so companies in aggregate paid out a small share of what they earned. Did they earn less? No. They kept more, and they bought back more.
Where the Cash Went Instead
So where did the cash go? Mostly into buybacks. The second reason the index yield is near 1.1% is that a growing share of shareholder cash goes out through repurchases instead of dividends. In the 12 months to September 2025, S&P 500 companies spent a record $1.020 trillion on buybacks and $664.9 billion on dividends, $1.685 trillion in all, according to the S&P Dow Jones Indices release of Dec. 18, 2025. That puts buybacks at about 61% of the cash returned. Buybacks cleared $1 trillion over 12 months for only the second time, after the 12 months to June 2022 ($1.005 trillion).
The index’s payout ratio tells the same story. In Shiller’s data, trailing dividends over trailing as-reported earnings drifted from 55% in January 1960 to 49% in January 1990, to 44% in January 2020, and to 28% in June 2026. A lower payout ratio can mean companies chose buybacks over dividends. It doesn’t by itself mean profits fell.
As Joel Litman put it in 2020, “Share buybacks clearly aren’t driving the market higher – corporate fundamentals are.” Buybacks explain where the cash went. They don’t explain where the return came from.
When a Dividend Screen Misreads AbbVie
There’s a dividend that’s covered and a dividend that only looks uncovered, and on as-reported numbers a screen can’t tell them apart. A dividend screen usually starts with one quick test, dividends per share divided by as-reported EPS. On AbbVie, that math makes the dividend look uncovered. AbbVie’s Form 10-K shows dividends declared of $6.29 a share in fiscal 2024 and $6.65 in fiscal 2025, against basic EPS of $2.40 and $2.37. That’s roughly a 260% payout ratio in 2024 and 280% in 2025 on the reported numbers.
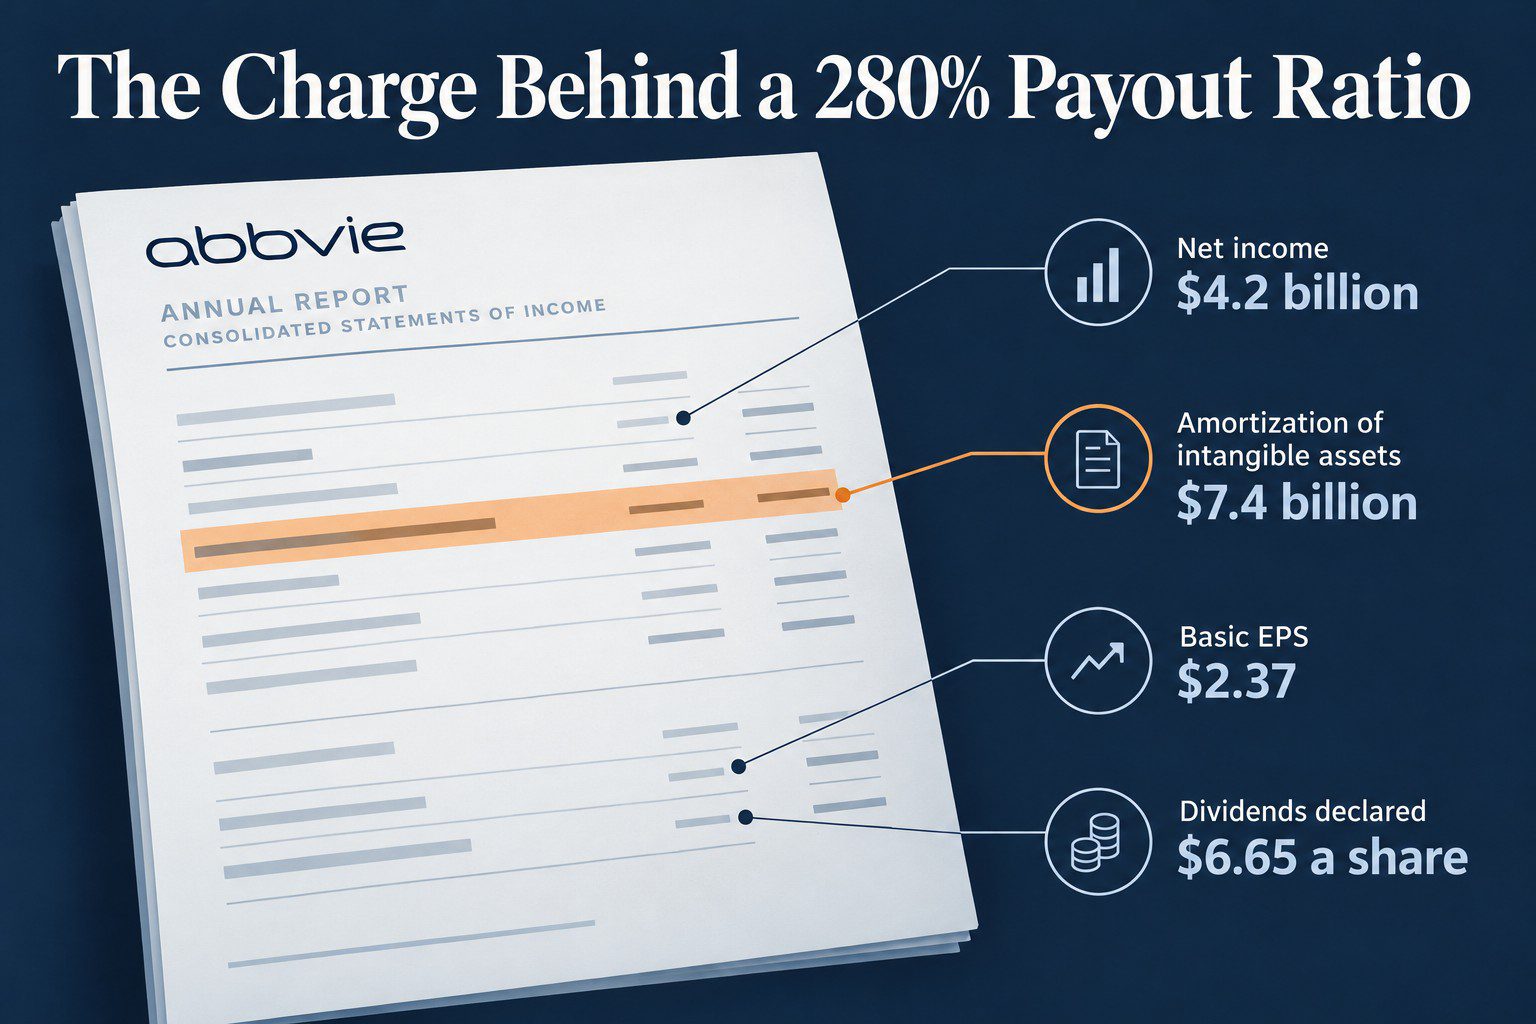
The 10-K also shows why the screen breaks here. AbbVie reported net income of $4.278 billion in 2024 and $4.226 billion in 2025, and amortization of intangible assets of $7.622 billion and $7.377 billion, a charge larger than net income in both years (AbbVie’s 10-K filings on EDGAR). An amortization schedule is nobody’s idea of a good read, but that one line explains the whole gap. If you treat as-reported EPS as the company’s earning power, you’ll call this dividend unsustainable because of an accounting charge.
Uniform Accounting, Valens Research’s method that makes more than 130 adjustments to as-reported statements so advisors can compare companies on one basis, gives a second read on the same payout. On Uniform EPS, AbbVie earned $18.52 in the prior fiscal year and $14.64 in the most recent one, which puts the same $6.29 and $6.65 dividends at about 34% and 45% of earnings.
| Metric (AbbVie) | As-Reported | Uniform |
|---|---|---|
| EPS, prior fiscal year | $2.40 | $18.52 |
| Dividend declared per share, fiscal 2024 | $6.29 | $6.29 |
| Dividend as % of EPS (2024) | about 260% | about 34% |
| EPS, most recent fiscal year | $2.37 | $14.64 |
| Dividend declared per share, fiscal 2025 | $6.65 | $6.65 |
| Dividend as % of EPS (2025) | about 280% | about 45% |
| Earnings margin, prior vs. most recent | 7.6% / 6.9% | 58% / 42% |
| ROA, prior vs. most recent | 8.3% / 10% | 50% / 34% |
Dividends declared per share and basic EPS are from AbbVie’s annual reports on Form 10-K (SEC XBRL data, retrieved Nov. 6, 2026). Uniform figures and as-reported margins and ROA are Valens Research data, Nov. 6, 2026.
So when a payout screen flags a company, don’t ask if a 280% GAAP payout ratio is allowed. Ask how large the dividend is against earnings measured the same way across companies, especially where GAAP earnings distort profitability through large amortization of intangible assets.
Three Checks Worth More than the Yield
None of us can know every company’s story. Three checks sort most of them. A 1.1% index yield can tempt you to treat dividend work as a macro call. You make the decision one company at a time, and three checks do more of the work than the yield does.
Begin with earnings measured on one basis across companies, Uniform EPS or Uniform ROA, rather than GAAP net income. Then size the dividend against those earnings, because dividend over price tells you what the market pays, not what the business can fund. Finally, separate dividends from buybacks. A repurchase is usually only a positive when the stock is undervalued, and it isn’t the same thing for the shareholder as a dividend.
The S&P 500’s 1.1% yield is an average of 500 separate price-and-payout decisions, and it says nothing about any one of them.
The FA Alpha 50 is a monthly list of 50 companies screened on Uniform earnings and returns, with the figures beside the as-reported ones.
FAQ
Why Doesn’t the S&P 500 Chart Match a Client’s Account Statement?
Most S&P 500 charts are price-only, while a client’s statement reflects total return, including dividends paid and reinvested. A price index and an account that reinvests dividends measure two different things.
Does a 1.1% S&P 500 Dividend Yield Mean Dividends Stopped Mattering?
No. In Shiller’s data, dividends per share rose over time even as the yield fell, because prices rose faster than dividends.
Does a Low Index Yield Mean Stocks Are Too Expensive?
Not by itself. The index yield reflects price and the payout mix, and it can fall because companies return more cash through buybacks instead of dividends, even while the dividends themselves grow.
Why Can a GAAP Payout Ratio Make a Dividend Look Unpayable When It Still Gets Paid?
Because GAAP net income and EPS don’t measure the same thing from one company to the next, and accounting charges like amortization of intangible assets can pull them down. Dividends measured against Uniform earnings often give a different picture of what the business can fund.
Are Buybacks the Same Thing as Dividends for an Income Plan?
No. A dividend is cash paid to the shareholder, while a buyback is usually only a positive when the stock is undervalued, and it doesn’t put cash in the account.