
Dividend Stocks Through a Uniform Accounting Lens
October 20, 2026
A dividend stock is worth owning when cash flow durably covers the dividend. The yield doesn’t settle that. Neither does the reported payout ratio.
A few months before a client retires, the portfolio’s job switches from growth to paying the bills, and dividend payers get a closer look. That’s when shortcuts tempt most, like sorting by yield or picking payers over non-payers. The useful check runs the dividend through the same coverage work you’d run on any recurring obligation.
This article covers why the reported payout ratio isn’t always the best metric, three coverage checks that hold up, and what to say when a client brings you an 8% yielder.
Key points
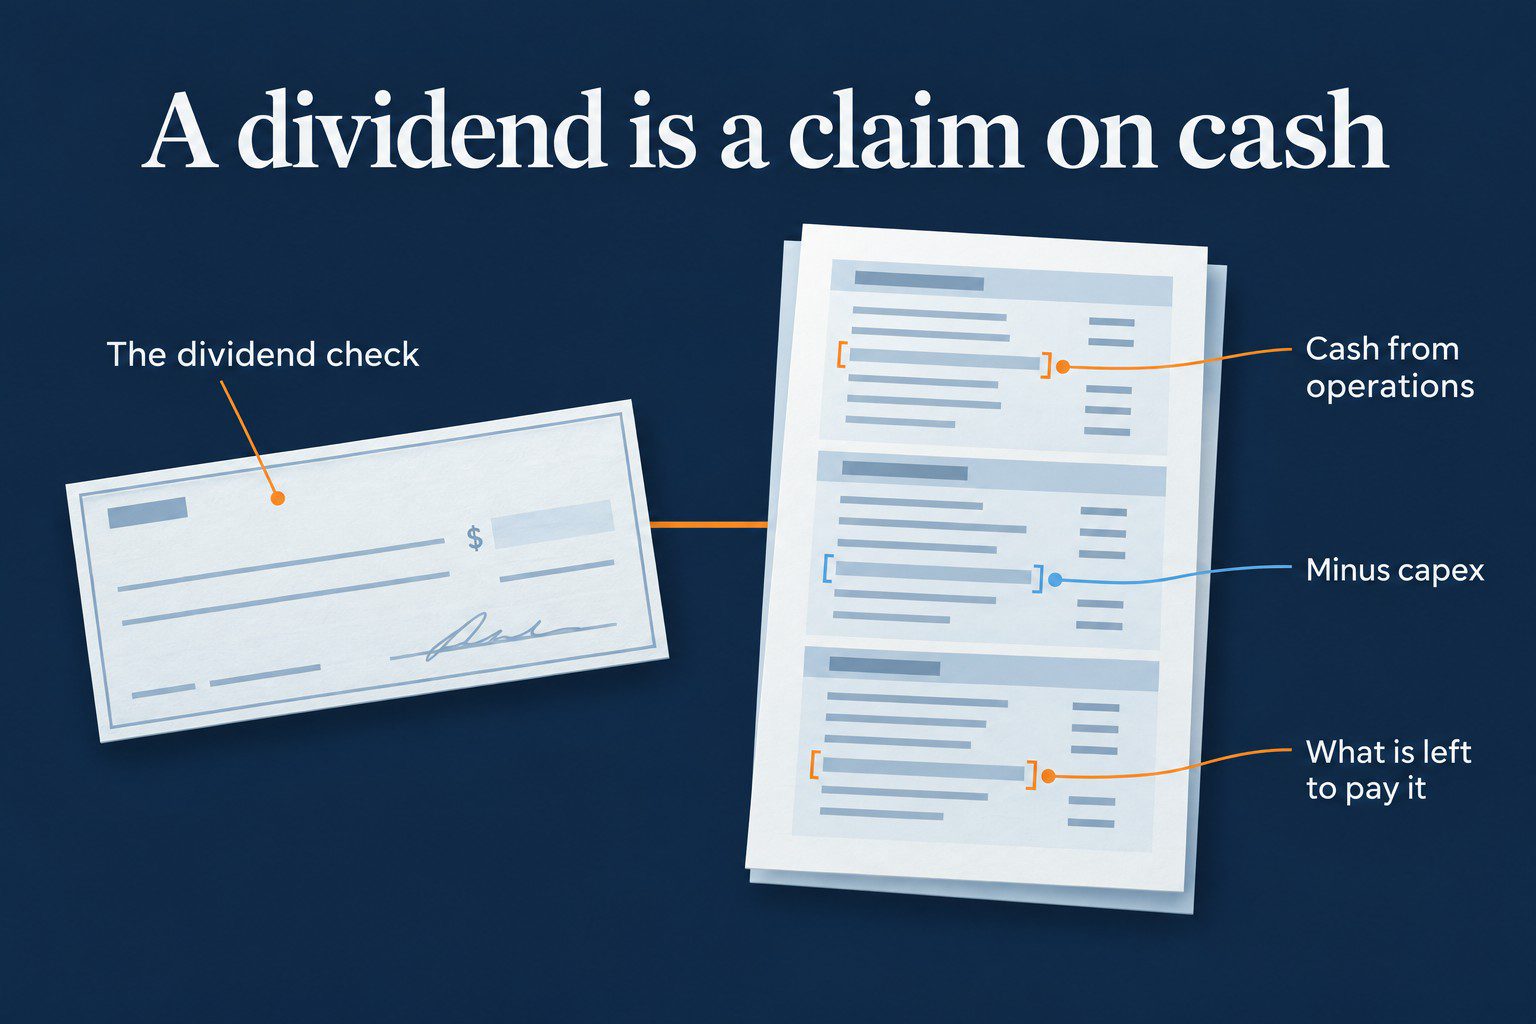
A Dividend Is a Claim on Cash Flow
A dividend is a promise paid in cash, quarter after quarter.
The SEC’s investor glossary defines a dividend as a portion of a company’s profit paid to shareholders. For an advisor, the investable question is narrower: can this business keep producing the cash that funds the check. Two stocks can show the same 4% yield while one of them has thinning coverage underneath.
Why the Reported Payout Ratio Isn’t Always the Best Metric
The payout ratio is simple. Dividends declared divided by net income.
The denominator is where the trouble hides. As-reported net income absorbs every timing choice and classification call management was permitted to make, along with one-time items that swing the number without changing the company’s ability to fund the dividend. A year with an impairment can make the payout ratio look dangerously high while cash generation held steady.
The reverse case is the one that catches clients off guard. As-reported earnings can be flattered by capitalization choices, tax timing, or non-operating gains, and the same distortions that affect earnings quality in an equity memo affect dividend coverage too. The common comfort threshold, under 60% is safe, is a convention. Label it that way in your notes.
None of this means the reported number is dishonest. It means the ratio needs a second denominator before it can carry a client conversation.
The Three Coverage Checks
One ratio can’t underwrite a dividend. Three views together can.
Uniform Accounting is a framework that adjusts each company’s reported financials to one rule set, so underlying earnings can be compared across companies and across time. That Uniform view is the backbone of all three checks.
1. Recompute the Payout Ratio on Uniform earnings
Run the same payout math on Uniform earnings instead of as-reported net income. You’re looking for names where reported coverage reads fine while the underlying denominator shrinks once timing and classification noise comes out.
The memo-ready version is a bridge. Put the as-reported payout ratio beside the Uniform payout ratio, plus the two or three adjustments that moved the result. A large gap means the reported ratio can’t be your anchor number, even though it’s the one clients recognize.
2. Check Coverage Against Free Cash Flow
Free cash flow is cash from operations minus capital expenditures, and it’s what funds the check. When free cash flow runs short of the dividend, the difference comes from cash on hand or new borrowing, and that arrangement can persist for years.
Document the direction and the persistence. Has free cash flow covered the dividend over a full cycle, and when it didn’t, which balance sheet line filled the gap? The workflow is the same one you use for reading a cash flow statement.
3. Tie Durability to the Uniform ROA Trend
A dividend is only as durable as the returns funding it. Uniform return on assets (‘ROA’) puts that on one comparable scale, and the Daily’s benchmark for it is the 12% corporate average.
A company can hold as-reported EPS steady while Uniform ROA compresses from strong toward average. When that happens, the economics behind the payout are weakening even though the headline numbers aren’t, and the coverage work needs to get stricter.
Example: Same Dividend, Thinner Coverage
Example Co. is an illustrative company, and the numbers are made up.
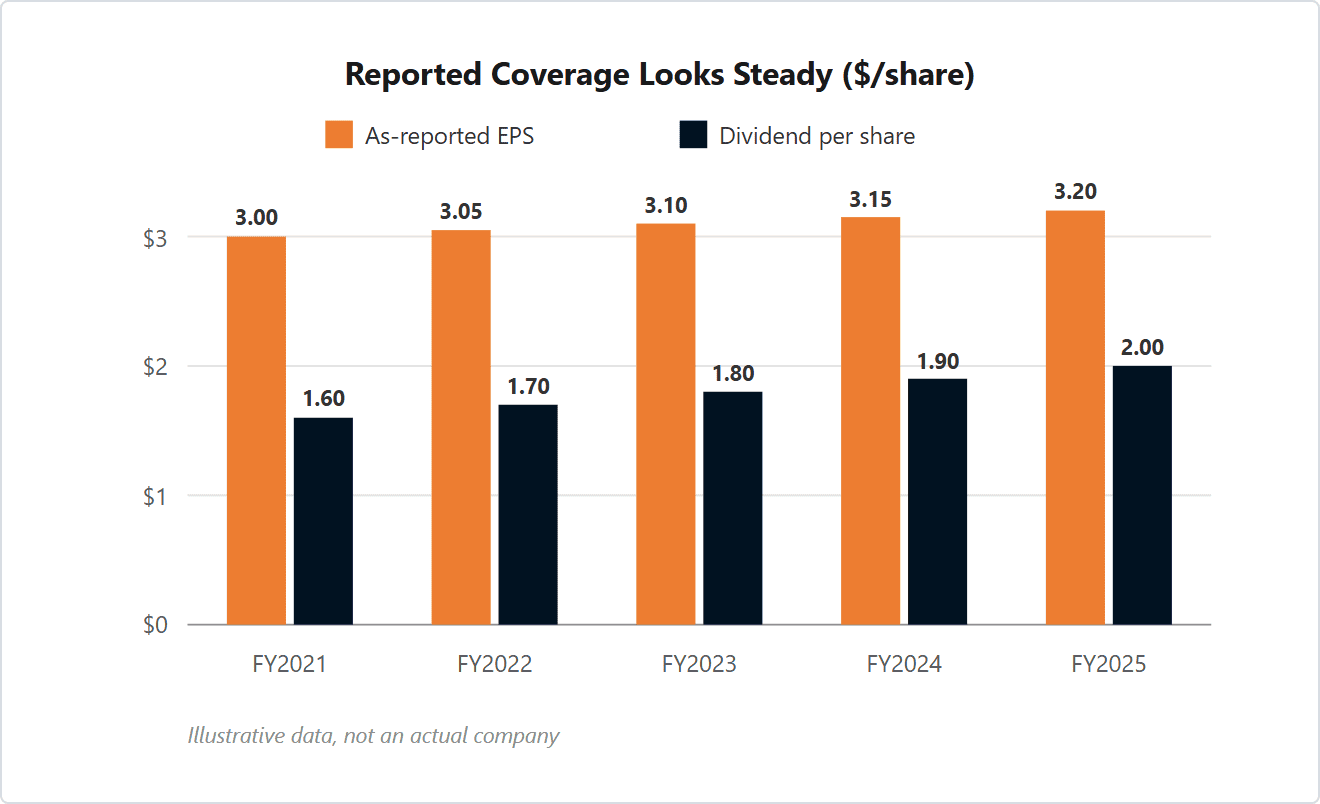
Example Co. pays $2.00 per share. As-reported EPS is $3.20, a 63% payout ratio that looks comfortable in any stock screener. Over five years, the dividend grew from $1.60 to $2.00 while as-reported EPS held between $3.00 and $3.20, so reported coverage looks flat and safe.
Under Uniform Accounting, the picture changes. Uniform EPS has slipped from $2.60 to $2.25 over the same five years, so the Uniform payout ratio is 89% and rising. Coverage on Uniform earnings has narrowed from 1.6x toward 1.1x. Free cash flow per share is $1.80, short of the $2.00 dividend, and the difference has been borrowed for two years running.
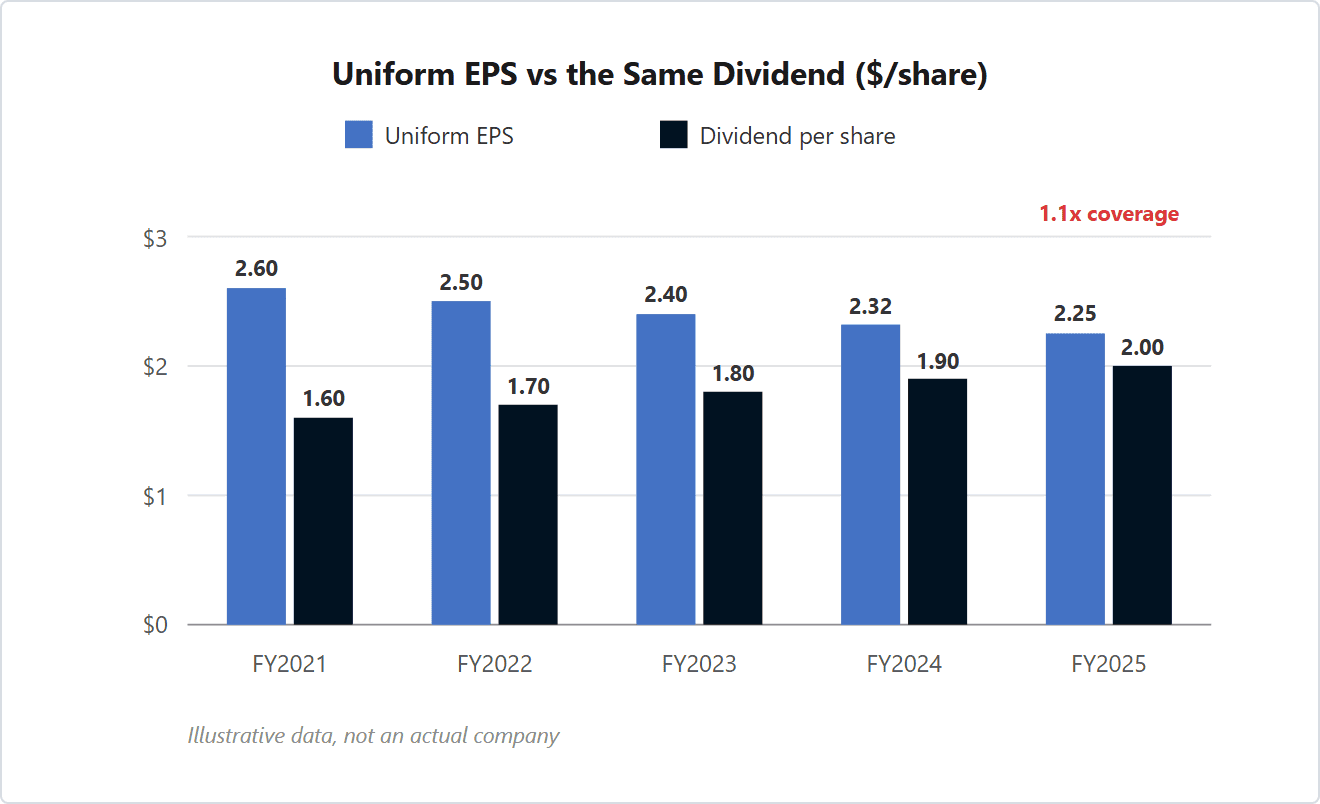
Nothing in the reported numbers announced this. The dividend record is spotless, the reported payout is 63%, and the screen still calls it a quality income name.
Why Yield Screens Find Cuts
A high yield is usually a price signal.
Yield equals dividend divided by price, so a yield-sorted screen often ranks the biggest price decliners rather than the most durable payers. The dividend may not have moved at all. The price did, because the market began pricing in weaker earnings power or tighter cash flow.
The same trap logic applies to undervalued stocks found on raw multiple screens, where the names that look cheapest are disproportionately the ones with the weakest numbers underneath. An outsized yield is a reason to run the three coverage checks before anything else. When they pass, the market may be mispricing durable cash flow, and that’s a genuine opportunity. When they fail, the yield was the warning.
Five Checks You Can Document
Coverage work only protects you if it’s written down.
The five checks below give a dividend position a paper trail. They record what funds the check, what’s tightening, and what you’d need to see before changing your mind. Understanding why GAAP earnings can distort profitability explains most of the first row.
| Dividend check | Where to look | Warning sign |
|---|---|---|
| Payout ratio on Uniform earnings | Uniform EPS beside as-reported net income, with the adjustment bridge | Reported payout looks reasonable while the Uniform payout is much higher or rising |
| Free cash flow coverage | Cash from operations minus capex, reconciled to dividends paid | Dividend exceeds free cash flow for several periods, with the gap filled by debt or cash drawdown |
| Uniform ROA trend | Uniform ROA over three to five years against the 12% corporate average | Returns drifting toward or below average while the dividend obligation grows |
| Debt load and maturities | Net debt, interest expense, and the nearest maturities in the filings | Large refinancing needs landing in the same window as thin coverage |
| Dividend record beside buybacks | Multi-year dividend history alongside net buybacks or dilution | Dividend maintained while buybacks quietly disappear, a sign total cash return is tightening |
The FA Alpha 50 runs this same restatement discipline across the whole market each month, which is one way to source payers whose Uniform numbers already pass. The list is a research input; every position still needs the coverage file.
Three Client Conversations
Most dividend conversations start with a screen number and a request for a yes or no. The lines below answer with coverage numbers a client can follow.
A Client Wants to Buy an 8% Yielder
“An 8% yield usually means the price fell, so let’s find out why the market marked it down. Before we do anything, I want the reported payout ratio beside the adjusted one, and I want to see whether free cash flow has covered the dividend.”
A Retiree Asks Whether the Income Is Safe
“I can’t call any dividend safe from the yield alone. What I can show you is whether Uniform earnings and free cash flow cover it, and whether the returns funding it are holding up or fading. That’s a much better basis for your income plan than a label.”
Explaining Why You Sold Before a Cut Was Announced
“We didn’t sell because we predicted a cut. We sold because the coverage tightened: the adjusted payout ratio kept climbing, and free cash flow stopped covering the dividend. When the reason we owned it stopped being true, we moved on.”
Key takeaways
- A dividend is a claim on cash flow, and neither the yield nor the reported payout ratio proves the cash is there.
- Recompute the payout ratio on Uniform earnings and check it against free cash flow; large gaps change the story.
- Durability follows returns: a dividend funded by Uniform ROA above the corporate average is on firmer ground than one funded by borrowing.
- An outsized yield is a prompt to run the coverage checks, never a reason to skip them.
Frequently Asked Questions
What Are Dividend Stocks?
Dividend stocks are shares of companies that pay a regular cash dividend to shareholders. For an advisor, the label matters less than whether durable cash generation funds the payment. The practical test is coverage, measured on both as-reported and Uniform earnings and confirmed against free cash flow.
What Is a Good Dividend Payout Ratio?
It depends on the stability of the business and on which earnings figure is in the denominator. The common rule that a payout under 60% is safe is a convention, because as-reported net income moves with permitted accounting choices and one-time items. A more defensible read computes the ratio on both as-reported and Uniform earnings and documents what drove any gap.
Are High Dividend Yields Safe?
A high yield often reflects a fallen price rather than a stronger income stream, and the price usually fell for a reason. Run the coverage checks before concluding anything. The yield is a prompt for the work; it isn’t evidence the dividend will persist.
How Do I Know if a Dividend Is Safe?
No single ratio proves safety, but coverage risk can be documented. Compare the reported payout ratio with the same ratio on Uniform earnings, test whether free cash flow covers the dividend, and check the trend in Uniform ROA. When all three hold up over a full cycle, the dividend rests on the business rather than the balance sheet.
Coverage work, one company at a time
FA Alpha Daily applies this to one company, metric, or market signal every morning, free for financial advisors.