
Dividend Yield: What It Measures and What It Leaves Out
November 3, 2026
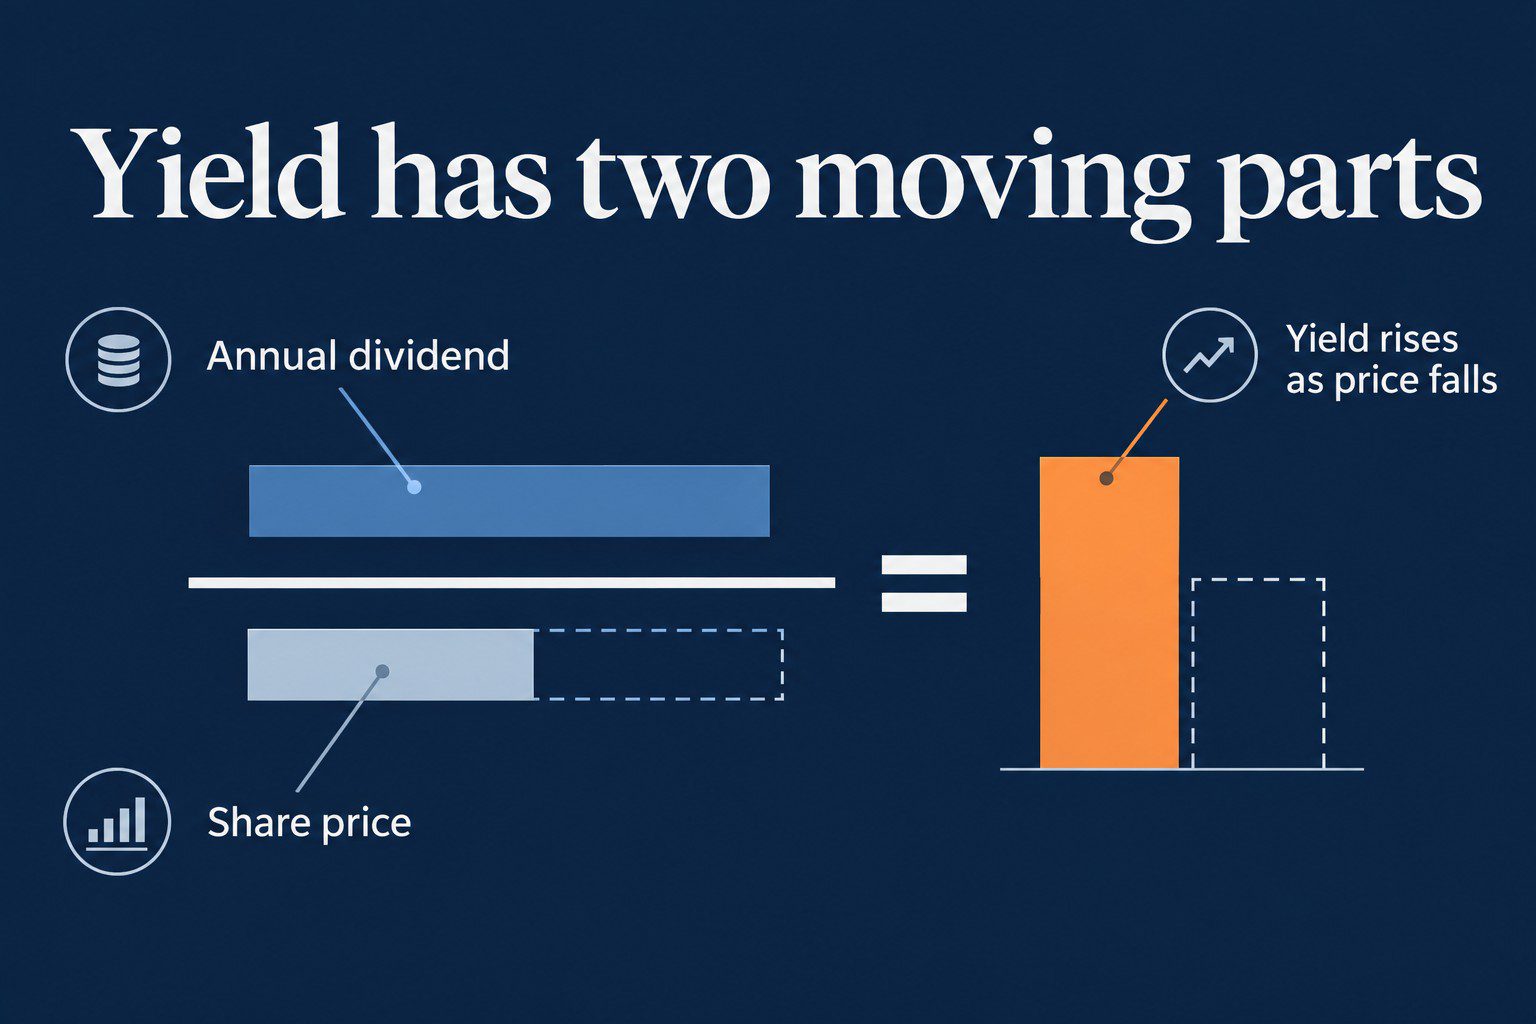
Dividend yield is the annual dividend per share divided by the current share price, expressed as a percentage. You can annualize the dividend two ways, the past 12 months of payments or the latest quarterly payment times four. The ratio has two moving parts, the dividend and the price, and only one of them is the company’s decision. So a high yield is as often a falling price as a generous payout.
Advisors and clients ask the yield to do one thing, tell them if the dividend will hold, and the number alone can’t. For scale, the S&P 500 yielded 7.44% at the end of 1950 and an estimated 1.06% as of September 28, 2026 (multpl).
Key points
- Trailing yield shows the pre-cut dividend for up to a year, while forward yield drops at once.
- Tanger fell 60% to $15, pushing its yield near 9.5% before it suspended the dividend in 2020.
- Iron Mountain held, Tanger suspended, and Blackstone Mortgage Trust cut, and yield predicted none.
- A 4% yield was below the market’s 4.93% in 1982 and roughly four times its 1.15% in 2025.
- Test whether cash flow plus cash covers maturities, maintenance capex, and the dividend each year.
How Do You Calculate Dividend Yield?
There are two ways to annualize the dividend, and they give different answers around a cut or a raise. Trailing dividend yield sums the last 12 months of dividends per share and divides by today’s price. Forward, or indicated, dividend yield takes the most recent quarterly dividend, multiplies it by four, and divides by the same price.
They diverge when the rate changes. After a cut, the trailing yield keeps showing the higher, pre-cut dividend for up to a year, while the forward yield drops at once. After a raise, the trailing yield lags the other way, because the older, lower quarters stay in the 12-month sum.
That timing difference is what MSCI warned about in a 2019 note on what it calls a yield trap. In a sharp sell-off, “the trailing yields could artificially spike only to be abruptly reduced upon the occurrence of reduced or discontinued dividends,” which “played out during the GFC as some banks cut or stopped paying dividends” (MSCI, October 25, 2019).
Why Does Dividend Yield Rise When Price Falls?
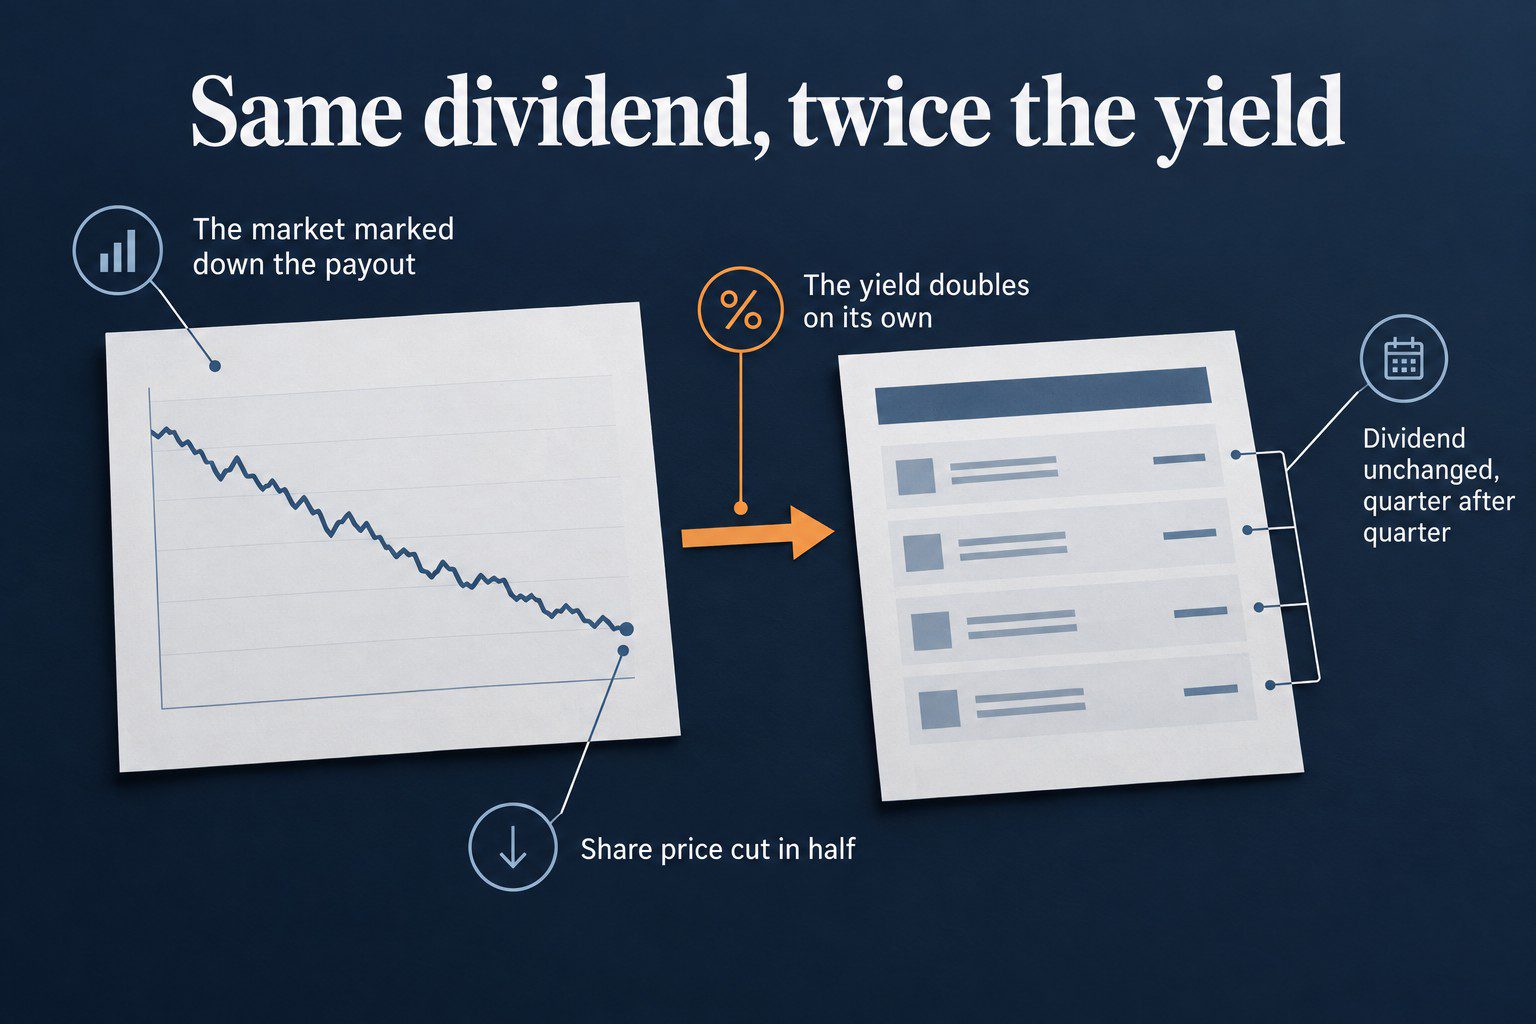
The price is the denominator. Hold the dividend steady and halve the price, and the yield doubles. The company hasn’t become more generous. The market has marked down what it thinks that dividend is worth.
Tanger Factory Outlet Centers shows the sequence. On December 12, 2019, Valens wrote that the stock had “dropped from over $41 at its peak in mid-2016 to $15 currently,” a 60% fall (Valens, December 12, 2019). Tanger was paying $0.355 a quarter at the time (Tanger Form 10-Q, first quarter 2020). That is $1.42 a year, and on a $15 share it is a yield near 9.5%. Valens didn’t quote a yield. The 9.5% comes from dividing the $1.42 by the $15.
The same note read as-reported ROA against Uniform return on assets (ROA) and checked the Uniform price to earnings (P/E) ratio as well as the yield. Its title said a 60% fall didn’t make the stock a screaming buy. In May 2020, citing the pandemic, the board suspended the dividend to conserve about $35 million a quarter (Tanger, November 5, 2020). On January 14, 2021, the dividend came back at $0.1775 a share, half the early-2020 rate (Tanger, January 14, 2021).
Does a High Dividend Yield Always Mean a Cut Is Coming?
No. A high yield often means the stock is under pressure, but the yield alone can’t tell a dividend that will hold from one that won’t.
On April 29, 2020, Valens wrote that Iron Mountain’s dividend yield had “surpassed 9%,” nearly double what its 2025 bonds paid at a yield to worst near 4.7% (Valens, April 29, 2020). Its Uniform ROA had held in a steady range for more than a decade. Its obligations sat above its cash flows, which Valens read as “an average risk to its dividend or operations.” The dividend held. The board declared $0.6185 a share in November 2020 and again in February 2022, the rate it had paid since late 2019.
British American Tobacco carried a yield of around 9.8% on May 7, 2024, which Valens read beside stable earnings and stable cash flows (Valens, May 7, 2024).
Blackstone Mortgage Trust held a $0.62 quarterly rate from 2015 and cut it 24% to $0.47 in July 2024. Altimetry put the saving at about $100 million a year, and the stock fell 11% the day after the announcement (Altimetry, September 3, 2024). Altimetry’s obligations analysis showed why. The REIT wouldn’t have the cash flow to meet all its obligations in any of the next three years, and “In 2025 and 2027, it won’t be able to pay dividends.”
The level of the yield predicted none of the three. Iron Mountain held, Tanger suspended, and Blackstone Mortgage Trust cut. The yield raised the question, and the cash flows against the obligations answered it.
What Is a Good Dividend Yield?
There is no good number, because the market’s own yield moves. A 4% yield was below the S&P 500 at the end of 1982, when the index yielded 4.93%, and it was roughly four times the index at the end of 2025, when the index yielded 1.15% (multpl, S&P and Shiller data).
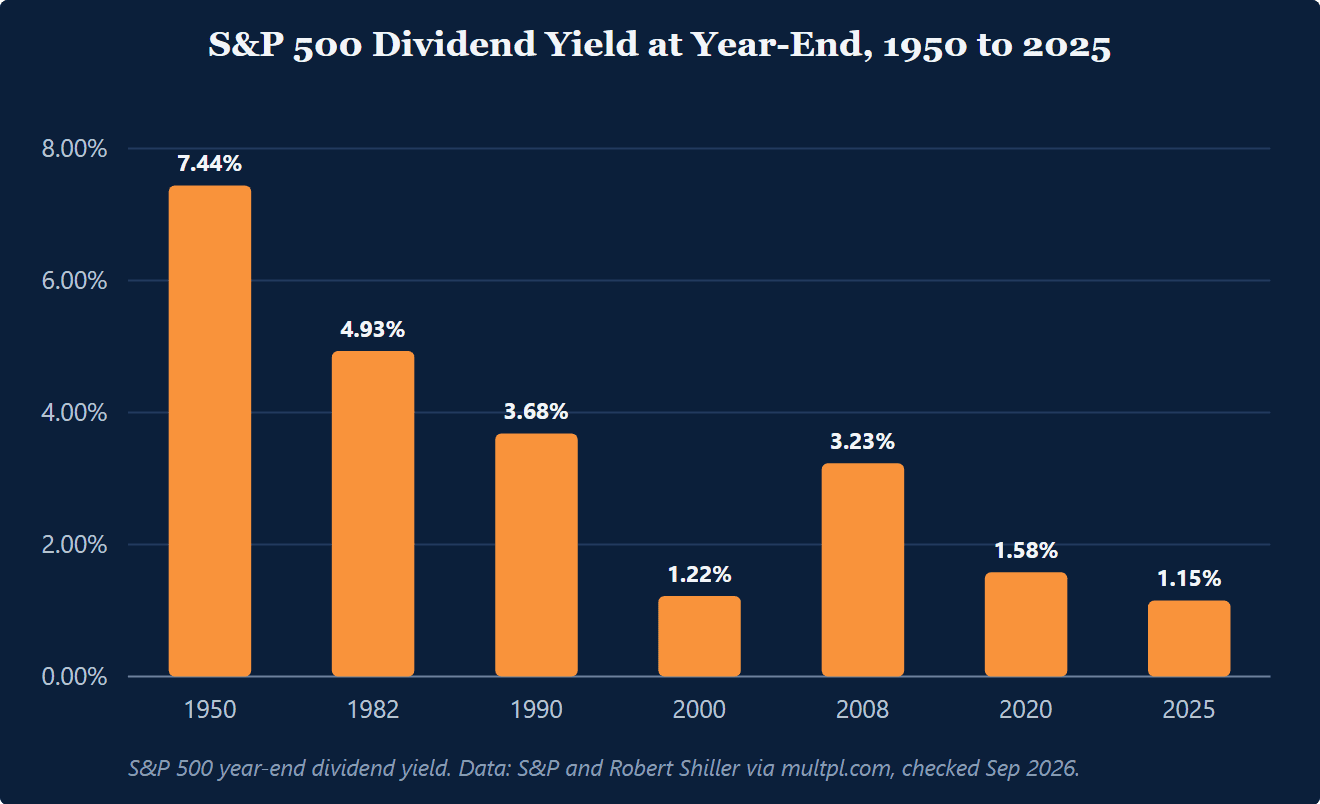
So a fixed cutoff for high yield means little on its own. The number only means something relative to what the broad market is paying, and relative to what has to happen inside the business for that rate to hold.
Extra Space Storage shows a yield that rose because the dividend rose. On September 4, 2025, Altimetry wrote that Extra Space “has grown its dividend from $2.24 per share in 2015 to $6.48 last year.” It called that “a 4.6% dividend yield, way above the S&P 500 Index’s 1.2% average,” with occupancy “above 94%” (Altimetry, September 4, 2025). REIT yields also run higher partly because REITs must pay out at least 90% of taxable income to shareholders, a rule the same piece states.
What Answers the Question a High Dividend Yield Raises?
A high yield raises one question. Will the dividend hold? The usual next step is the payout ratio. That ratio runs on reported earnings, and reported earnings aren’t comparable across companies, so it is where most explainers stop and where the work should start.
Ford shows why a payout ratio under the usual comfort line can’t settle it. On April 4, 2025, Valens wrote, “The 6% dividend yield looks attractive, but with a payout ratio nearing 60%, there’s little room for error.” At the stock price then, Valens noted, the market expected Ford’s Uniform ROA to stay below its cost of capital (Valens, April 4, 2025). The common “under 60%” comfort line is a convention. It says nothing about the cash.
How Do You Test If a Dividend Will Hold?
The test that answers the question is the stack. Compare cash flow plus cash on hand with the company’s obligations, in order, year by year. Debt maturities and maintenance capex come before the dividend. Valens and Altimetry publish this as a stacked chart, with the bars showing obligations and the overlays showing cash flow, cash on hand, and an undrawn revolver (Altimetry, May 10, 2021).
Turning Point Brands is what a pass looks like. On February 15, 2024, Valens wrote that its “cash flows and cash on hand are 5x its total obligations, including debt maturities, capex maintenance, and dividends.” Valens rated its dividend risk low beside a high credit risk (Valens, February 15, 2024).
The cash flow line has to be comparable across companies first. Uniform Accounting makes over 130 adjustments to the reported statements so earnings and cash flows are on one basis. The cash flow statement shows the cash that pays the dividend, so anchor the work there rather than on the payout ratio.
A 6% yield isn’t the analysis. As the undervalued stocks page puts it, don’t let it distract the committee when cash conversion says otherwise. Doing this across every income holding in a book of clients is a data job, and the research platforms page compares the tools that do it.
Key takeaways
- The company controls the dividend but not the price, so a high yield is as often a falling price as a generous payout.
- Trailing and forward yield split around a cut, and the trailing figure keeps showing the old dividend for up to a year.
- Judge a yield against what the market pays, since 4% was below the S&P 500 in 1982 and roughly four times it in 2025.
- Before leaning on the payout ratio, test if cash flow plus cash on hand covers debt maturities, maintenance capex, and the dividend, year by year.
Frequently Asked Questions
What Is a Good Dividend Yield?
There isn’t one good number, because the baseline moves. A 4% yield was below the S&P 500’s 4.93% year-end yield in 1982, and it was roughly four times the S&P 500’s 1.15% year-end yield in 2025.
Is a High Dividend Yield Good or Bad?
It depends on why it’s high. Dividend yield has two moving parts, and only the dividend is the company’s decision, so a high yield can be the market marking down the stock price and doubting that the dividend will hold.
What Is the Difference Between Trailing and Forward Dividend Yield?
Trailing dividend yield sums the past 12 months of dividends, while forward, or indicated, dividend yield multiplies the most recent quarterly dividend by four. They split after a cut or a raise, because the trailing yield can show the old rate for up to a year while the forward yield updates at once.
What Is the Dividend Yield of the S&P 500?
The S&P 500’s year-end dividend yield was 1.15% in 2025. As of September 28, 2026, multpl’s estimate was 1.06%.
One company on the numbers, every morning
FA Alpha Daily applies this to one company, metric, or market signal every morning, free for financial advisors.