
Corporate Credit Risk: What a Downgrade Doesn’t Tell You
October 22, 2026
A client is reading Yahoo Finance and sees a downgrade headline that makes them nervous. Their main question is if the bond fund still belongs in their portfolio. The first answer you should give them is that a downgrade only tells you that a rating agency changed its label. It doesn’t prove that the company’s ability to pay has changed at all.
Those are two very different things. Timing is what separates them. Can this business generate and keep enough cash to meet what it owes before the next refinancing window closes? Everything useful you can tell that client comes out of answering it.
The ratio screen won’t get you there, and you’ll find out why below. Reported leverage and coverage are built on numbers that don’t describe what the company owes. Leases and EBITDA are the two traps that catch people most often. Then the measures that put cash and obligations on the same calendar.
Key points
- Map the debt maturity wall before you trust any leverage ratio.
- Debt-to-EBITDA and interest coverage answer a timing question with a snapshot that has no clock.
- ASC 842 put operating leases on the balance sheet, yet lease cost still skews coverage.
- Credit Cash Flow Prime, the maturity headwall, and recovery line up cash against dates.
Corporate Credit Risk Depends on the Date
Credit trouble is usually a scheduling problem. But it’s all but invisible until the company runs out of time.
A downgrade headline reads like news, but the credit story was usually settled earlier, by the schedule. One day, the company finds it’s out of options, and only then does the press take notice. So start with the debt maturity schedule rather than the ratio screen.
Think in terms of a maturity wall, meaning the specific quarters and years when debt maturities stack up. Ask if the business can generate and keep enough cash to meet those maturities, or if it has to refinance into a market that may not be open at a coupon your client can live with. That’s the difference between “spreads moved” and “this issuer’s survival window narrowed.”
If you write investment committee notes, you already know how this changes your work product. A hypothetical memo line like “Leverage is 4.5x” is a number without a clock attached. “They have a heavy 18-month maturity wall and only one realistic refinancing window” is a specific argument, because it forces you to name the dates, the required dollars, and the sources of cash.
| Memo Question | What To Pull | What You’re Testing |
|---|---|---|
| What comes due, and when? | Maturities by year. Pull forward springing covenants, put options, near-term revolver renewals | The obligation calendar and the first “gate” date |
| What cash can the business keep before then? | Cash remaining after keeping the business intact, rather than EBITDA that ignores maintenance spend and working capital absorption | Whether internally generated cash can cover the next window |
| Where does refinancing access come from? | Specific channels: a bank revolver, an ABL facility, a secured bond, or an equity follow-on bank revolver capacity, secured debt capacity, asset sales, equity-linked options | Whether “we can refinance” is a named, plausible path |
| What changes if the window shuts? | Stress: spreads gap wider, lenders pull back, covenants tighten | Whether timing turns into urgency given the maturity wall |
That table runs against your instincts in two places. A stable rating can survive a bad maturity wall for longer than you would expect, and the agencies can downgrade a company in the very quarter its schedule got easier because it termed out its debt early. A rating is what Moody’s and S&P decided to call the risk. The calendar is what the company has to answer to.
Look through a credit-heavy balanced fund and you can find two issuers with almost identical reported leverage and coverage. One has its maturity stack in 2027 with ample liquidity behind it. The other has a heavy 2026 maturity and a revolver renewal standing in front of it. Only the second turns a headline into a portfolio conversation, and nothing in the ratios told you which was which.
So before you argue about valuation, spreads, or whether the market is overreacting, build a one-page obligation timeline for the issuer and write down the refinancing path you believe exists. A credit view fits that path into two sentences.
Build that calendar from every obligation that behaves like debt, whatever the balance sheet calls it. Capitalized leases belong on it, and so do underfunded pension commitments, which are immovable and routinely left out. For the wider backdrop, the Federal Reserve’s Financial Stability Report is the aggregate reference an investment committee will recognize.
Why Ratio Screens Can Mislead You
Let’s say an advisor writes a clean IC memo off a leverage screen. Then they get blindsided when the revolver renewal blocks the company. The screen wasn’t wrong. It had no clock attached to it.
Ratio screens can mislead you because they let you answer a timing question with a static snapshot. Debt-to-EBITDA and interest coverage can look “fine” right up until a maturity wall forces a refinance, and then the same issuer suddenly looks unfinanceable even though the underlying business didn’t change that quarter. The screen worked. It had no dates in it.
The other problem is that the top and bottom of these ratios often describe different obligations. Leases are the clearest case, and the next section takes them apart.
Lease-adjusted coverage and the question of what clears the headwall both get easier to defend once you tie reported performance back to the cash the business generates. Our guide to reading a cash flow statement works through that line by line. The same trap on the equity side runs through earnings quality.
Leases And The EBITDA Trap
Even with the correct ratio work, you might still not understand the cash claims creditors are facing. That’s how a downgrade becomes a conversation about the wrong numerator, the wrong denominator and the wrong timeline.
If leases are still a footnote problem in your head, you’re still thinking in 2018 terms. ASC 842 put operating leases on the balance sheet for fiscal years beginning after December 15, 2018. The trap didn’t disappear when that happened. It moved to the income statement, where lease cost still runs through operating expense.
So the debt total on the balance sheet and the coverage ratio built off the income statement are counting different things. You can watch debt rise as lease liabilities land, see reported interest expense barely move, and conclude that coverage improved when the fixed claim on the company’s cash did not change. The fix is mechanical. Pull rent out of operating expense, add back the implicit interest, and carry the lease as debt. Then both halves of the ratio describe the same obligation.
Where the Distortion Gets Worse
The distortion gets worse because lease treatment is a matter of contract design. Two retailers can have the same store economics and very different reported obligations if one signs shorter cancellable leases with extension options and the other locks in long non-cancellable terms. You’ll be tempted to treat the one with a smaller reported lease liability as the safer credit. That can be the wrong conclusion, because you’re comparing contract design as much as economics.
EBITDA adds the second layer of misdirection. It’s a performance subtotal creditors can’t spend, and add-backs inflate it easily while the business still has to fund the maintenance spending that keeps revenue intact. An issuer holds EBITDA steady through a soft patch and still walks into a tighter refinancing window, because maintenance spending and other recurring needs took the cash that was meant to meet the maturity wall.
In the memo, write one sentence separating fixed claims, lease-like obligations included, from the spending management can defer, and tie both to dates. A creditor view begins with the path from EBITDA to cash before the next refinancing window.
The Three Uniform Credit Measures
Market-level pricing will never answer an issuer-level question. The ICE BofA US High Yield index option-adjusted spread was 2.67 percent on September 8, 2026, which tells you what investors charge for below-investment-grade risk in aggregate and nothing about any single borrower. For that you need measures anchored to named obligations and the dates they come due.
Once you accept that credit risk is a timing problem, you need measures that line cash up against dates on one consistent basis. That is what Uniform Accounting is for. It’s the method Valens Research uses to adjust a company’s reported statements so that every business is measured the same way, which matters here because the balance sheet and the income statement are describing different obligations and a coverage ratio blends the two without telling you.
Credit Cash Flow Prime is the cash the business generates and keeps, mapped through time after the spending that keeps operations intact. It describes what the company can pay. The debt maturity headwall is the scheduled stack of maturities by period, and it tells you when that answer gets tested. Recovery is the third question, and it’s a separate one. If it goes wrong anyway, how much of the obligation stands to be recovered? That is a liquidation question rather than a solvency one, which is why it belongs beside the first two rather than inside them.
Putting every company on one basis is what forensic accounting does to the income statement. This is the same discipline pointed at what a business owes.
A Downgrade With No New Bill Behind It
Picture a high-yield issuer in a fund your client holds, on the morning the downgrade headline reaches you. On reported figures it screens like trouble. Leverage looks ugly, coverage looks thin, and the market prices it beside the CCC names. But if you stop there, you might mistakenly think the cash calendar is breaking, without having mapped a single obligation date.
There’s a public cost to each rating bucket. On Oct. 15, 2026, the ICE BofA CCC and lower US high yield index carried an option-adjusted spread of 12.78 percentage points over Treasurys. The single-B index carried 3.26 points, and the BB index 1.97 points (ICE Data Indices via FRED, Oct. 15, 2026 close, retrieved Oct. 16, 2026).
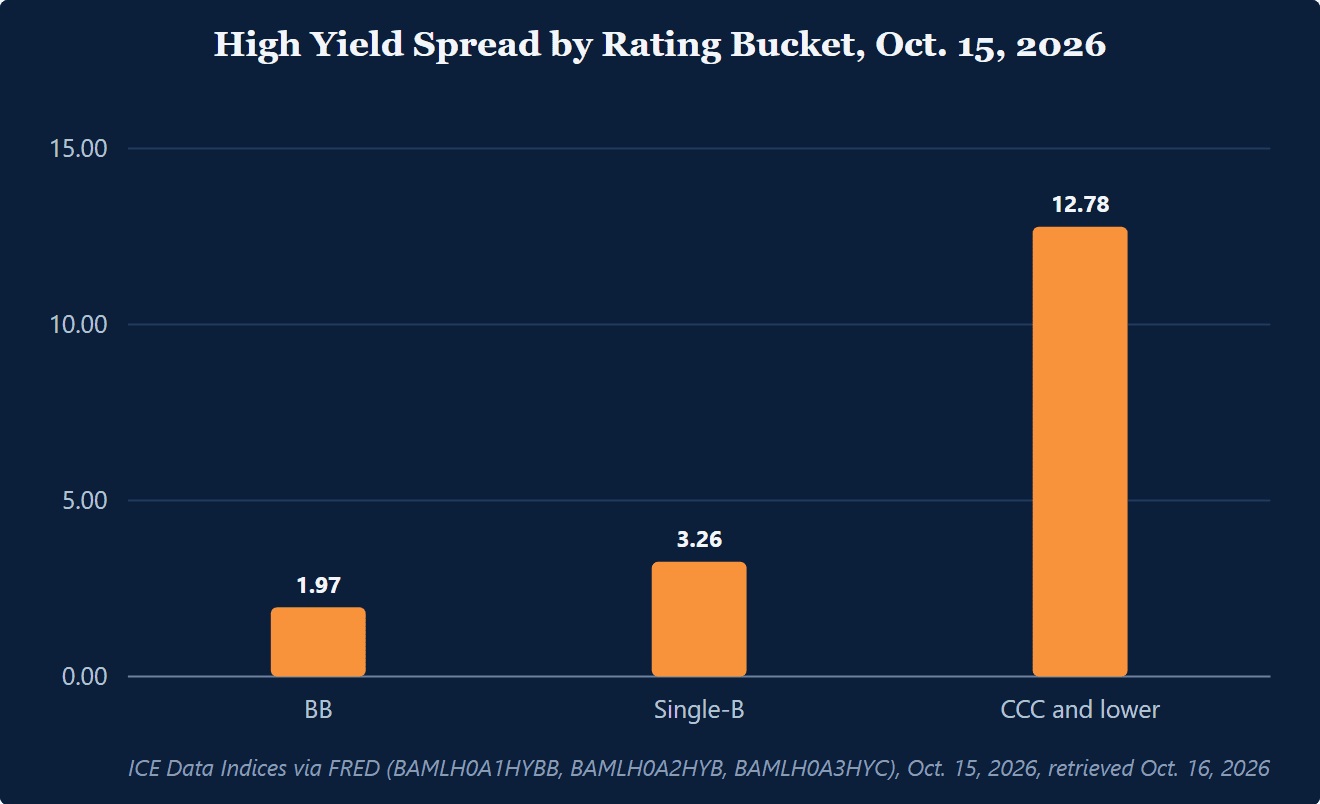
Now run the same fact pattern through the obligation set the business has to fund. When you treat lease obligations economically and separate maintenance spending from what management can defer, the cash that’s available to meet the debt maturity headwall often looks very different, and so does perceived default risk. Counted on consistent terms, the same obligations can describe a single-B credit rather than a CCC one. On Oct. 15, 2026, that was the gap between 12.78 and 3.26 points of spread, about nine and a half percentage points, without the business “getting better” overnight. The downgrade didn’t create a new bill. Your first pass counted the bills and the cash on mismatched terms.
What to Say to the Client Who Sent You the Headline
Here are three explanations you can use on a client call.
“A downgrade is an opinion update. Nobody sent the company a new bill.”
“That high-yield number you’re seeing is the price of risk across the whole market. It isn’t about this company.”
“What matters is what comes due next, and whether the business keeps enough cash to cover it without needing someone to refinance them on friendly terms.”
Key takeaways
- A downgrade is an opinion about the label. The cash reality is a separate question.
- Credit risk is a calendar problem. Map the maturity wall and the refinancing windows, then ask whether the cash the business keeps clears the next headwall.
- Leases came onto the balance sheet in 2019, but lease cost still runs through operating expense, so coverage understates what the company is committed to paying.
- Answer a timing question with debt-to-EBITDA and EBIT coverage and you have let accounting presentation write your credit memo.
Frequently Asked Questions
Does A Downgrade Mean The Company’s Ability To Pay Got Worse?
Not necessarily. A downgrade tells you the agency changed its label, and that often follows spread movement rather than predicts cash stress. Your job is to check whether the cash this business keeps still clears the next maturity, and any gate in front of it such as a revolver renewal.
Why Does The Equity Side Matter In A Credit Question?
Because equity market value shapes access to capital and bargaining power in a refinancing, even when the instrument you own is a bond. If the equity is large and liquid, the issuer has more viable paths to raise cash or de-lever, and creditors often face a different recovery dynamic than they do when the equity has already collapsed.
If High-Yield OAS Is Useful, Why Can’t I Use It To Explain A Single Fund Holding?
Because the ICE BofA US High Yield Index option-adjusted spread prices risk across the whole market, and its drivers are often entirely macro. Use it to frame conditions. It will never tell you what one borrower can or can’t refinance.
What’s The Practical Difference Between “EBITDA Is Fine” And “Cash Clears The Headwall”?
EBITDA can look stable while maintenance spending, working capital absorption, and fixed claims on cash leave you with little room to maneuver when the refinancing window narrows. An answer for a client or an investment committee ties the coverage story to specific dates and dollars that come due.