
Macro Signals and Asset Allocation: What to Watch
October 21, 2026
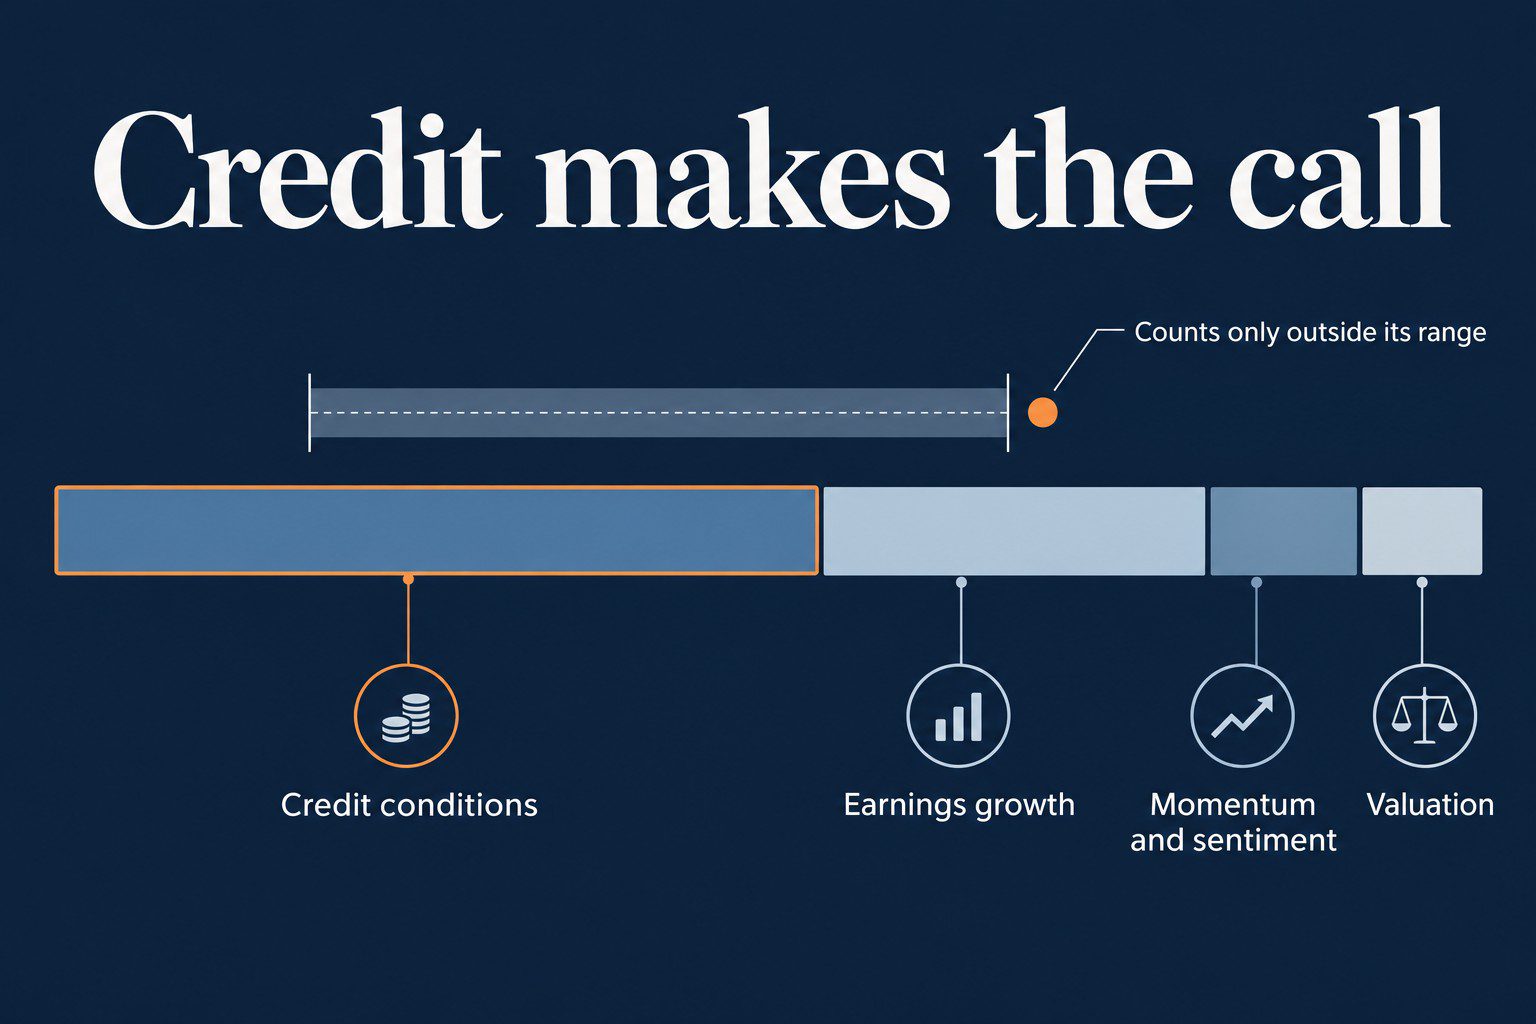
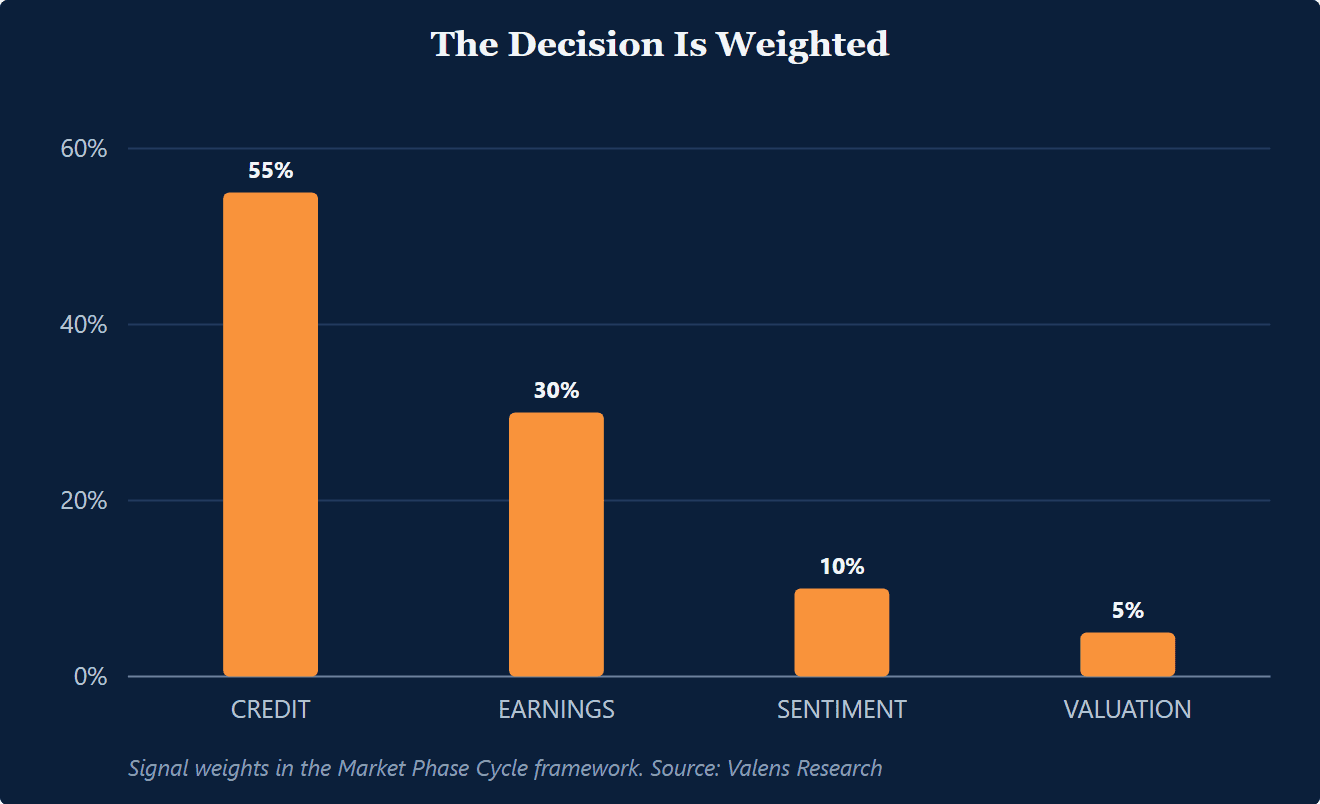
There are four signal families in asset allocation. In weight order, they are credit conditions, earnings growth, momentum and sentiment, and valuation. Valens Research’s Market Phase Cycle framework weights them 55%, 30%, 10%, and 5%, and the order is the insight. Credit leads, earnings confirm, sentiment matters at extremes, and valuation is context.
A signal counts only after it moves outside its normal range and stays there. A single print never qualifies, however loud the coverage.
Key points
- Credit conditions carry a 55% weight, more than the other three signal families combined.
- Read aggregate earnings on a Uniform basis so a few large write-downs don’t swamp the trend.
- Valuation carries a 5% weight and tightens risk bands, while credit and earnings handle timing.
- Record the monthly result even when the signals disagree and nothing changes.
Why Credit Conditions Are So Important
Credit carries more weight than everything else combined. Credit spreads, the yield gap between corporate bonds and similar-maturity Treasurys, measure what lenders demand to fund businesses. When that price rises and stays up, equity risk usually changes before the earnings data admits it.

If we were to completely believe everything we saw in the headlines, we would think every inflation print or weak auction was the whole story. Ask a simpler question first. Are borrowers paying more to fund themselves? Treasury yields are on the Federal Reserve’s daily H.15 release. Add one consistent investment-grade and high-yield spread series from a single documented source, and that’s the whole credit check.
Persistence matters most for allocation. When spreads break out of their normal range and stay wide for weeks, refinancing conditions have changed. A one-day jump that settles back means nothing.
Earnings Growth Confirms It
Earnings are a dependable confirmation signal. Can underlying corporate profit support the risk in the portfolio? That’s a trend question.
The input has to go on a Uniform basis first. As-reported aggregates carry the distortions Uniform Accounting removes. A few large write-downs can swamp the reported series while most companies’ underlying trends hold up. Reading the aggregate on a Uniform basis keeps that noise out of the allocation decision.
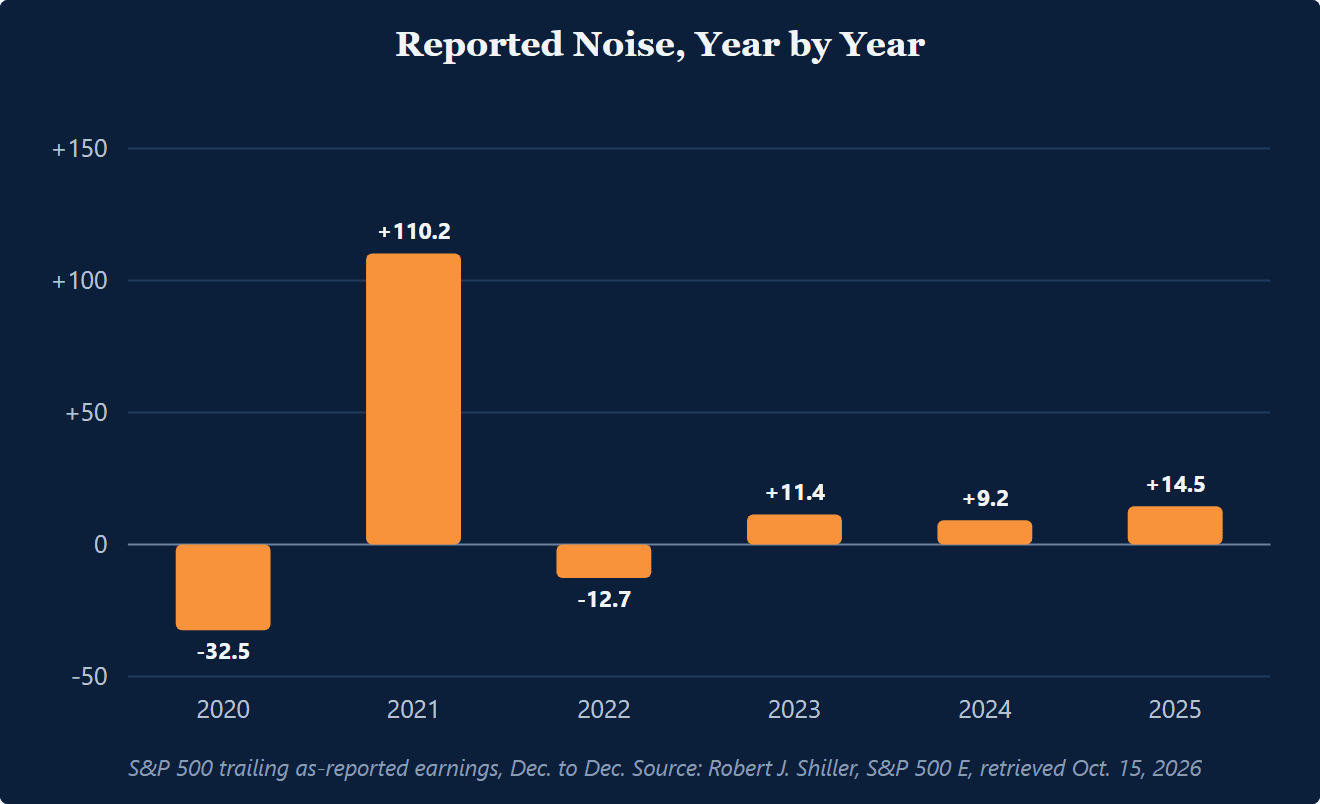
The chart shows the as-reported series alone. S&P 500 trailing as-reported earnings per Shiller’s data rose 110.2% from December 2020 to December 2021, after a 32.5% drop the year before, then fell 12.7% in 2022 and grew 11.4%, 9.2%, and 14.5% in the three Decembers since. The Uniform version of that series is what Valens reads in its monthly Market Phase Cycle, and it isn’t shown here. Figures from Robert J. Shiller, U.S. stock market data (ie_data.xls, shillerdata.com), S&P 500 E, retrieved Oct. 15, 2026.
Breadth and persistence are what matter here. When Uniform aggregate growth rolls over and revisions stay negative across several sectors for more than a few weeks, that confirms what tightening credit has already suggested. One soft earnings season, or weakness confined to a single sector, goes in the file as context.
Momentum and Sentiment Only at Extremes
Momentum and sentiment come next. Momentum shows what price is doing across the broad market. Sentiment is how aggressively investors are positioned and what they’re paying for risk.
Most months, both echo what credit and earnings already imply. They enter the decision only at extremes that persist, when positioning is crowded enough to make the market fragile. The clean way to read them is one repeatable monthly question. Is investor sentiment too bullish?
Valuation Sizes Risk
Valuation tells you what the market already assumes. It says almost nothing about when conditions change, which is why it carries the smallest weight.
The news treats a high multiple as an imminent warning. The weighted framework treats it as a constraint. When a yardstick like the Shiller PE sits well above its long-run range, the sensible response is tighter risk bands and a higher bar for adding exposure. Credit and earnings keep the timing job. High multiples can stay high for years.
Allocation Decisions
Most months, the signals disagree. Credit can stay calm while sentiment runs hot, and the weighted answer is then “mixed, no change.” That answer is a finding. Write it down every month anyway. When the change finally comes, the record shows it followed the rule.
The weights turn disagreement into a single number. In its August 2026 monitor, Valens read rising Treasury yields as borrower demand for credit rather than inflation fear. That’s what a credit-first framework does with a headline that scared the generalist press. The monthly Market Phase Cycle reading is published in FA Alpha Pulse. The short-list version of the signals is on our page about which macro signals matter for asset allocation.
| Signal family | Weight | Where to read it | What usually justifies a change |
|---|---|---|---|
| Credit conditions | 55% | Treasury yields on the Fed’s H.15 release, plus one consistent spread series | Spreads break their normal range and stay wider for weeks |
| Earnings growth | 30% | Aggregate growth and revisions on a Uniform basis | Broad revisions roll over and stay negative across sectors |
| Momentum and sentiment | 10% | Broad-market trend, positioning, and breadth | Extreme readings that persist |
| Valuation | 5% | A consistent market-level yardstick over time | Rarely a trigger by itself. It tightens or loosens risk bands |
There’s a practical test that can help you here. If the trigger can’t be written in one sentence without citing a headline, it’s noise.
Example: When to Change the Allocation
Change the allocation when heavily weighted signals break range and persist. Moody’s Baa corporate bond spread over the 10-year Treasury stayed between 1.55 and 1.82 percentage points, by monthly average, from January 2006 through July 2007. In August 2007 it widened to 1.98 and never came back, reaching 2.25 in November, 2.55 in December, and 3.38 in March 2008, and it was still 2.97 in June 2008. The S&P 500 monthly average price peaked at 1,540 in October 2007, two months after the break. That’s one episode, not a rule about lead times. Figures from Federal Reserve Bank of St. Louis (FRED), Moody's Seasoned Baa Corporate Bond Yield Relative to Yield on 10-Year Treasury Constant Maturity (BAA10Y), retrieved Oct. 15, 2026, and Robert J. Shiller, U.S. stock market data (ie_data.xls, shillerdata.com), S&P 500 P, retrieved Oct. 15, 2026.
The second family enters as a condition. The advisor’s written policy requires consensus earnings revisions to turn negative across sectors and stay there, read from the advisor’s own revisions source, before the two heaviest families count as broken together. When both hold, the policy trims equity from 65% to 55%, and the memo records the trigger on the day of the change. The 65% and 55% are policy settings written down in advance rather than readings from any series.
Compare that with a non-event. On April 7, 2025, the ICE BofA U.S. high-yield spread hit 4.61 percentage points, up from a March average of 3.17, and the coverage was loud. The April monthly average was 4.03, above the 2.70 to 3.55 range the series had held since January 2024. By May the average was 3.35 and by June 3.13, back inside the range. Moody’s Baa spread did the same on a smaller scale, averaging 1.90 in April 2025 and 1.71 by July. It felt urgent, and under the rule it changed nothing, because no weighted signal left its range and stayed out. High-yield figures from Federal Reserve Bank of St. Louis (FRED), ICE BofA US High Yield Index Option-Adjusted Spread (BAMLH0A0HYM2), ICE Data Indices, LLC, retrieved Oct. 15, 2026.
Client Language for Macro-Driven Changes
A change survives client scrutiny when the explanation is short and repeatable. The same two scripts cover most of the conversations. Our page on adding macro insight to client conversations covers the monthly rhythm around them.
When a Client Wants to Sell After a Scary Headline
“We change the portfolio only when borrowing conditions and company earnings move outside their normal range and stay there, because that’s what changes the risk of owning stocks. A headline alone never qualifies. Right now those signals are where they’ve been all year.”
When a Client Asks Why the Portfolio Changed When Markets Feel Fine
“Our policy trims risk when borrowing costs for companies stay elevated for weeks and earnings estimates keep falling, even before prices react. We made a measured shift and wrote down why. We’ll add the risk back when those signals normalize.”
Key takeaways
- Four signal families carry the allocation decision, weighted 55% credit, 30% earnings growth, 10% momentum and sentiment, 5% valuation.
- A signal justifies a change only when it breaks its normal range and stays out. Single prints and headlines never do.
- Most months the right answer is “mixed, no change,” and the monthly record is what shows the eventual change followed the rule.
- Valuation sizes risk while credit and earnings do the timing work.
Frequently Asked Questions
What Macro Signals Matter Most for Asset Allocation?
Credit conditions matter most, then earnings growth, then momentum and sentiment, then valuation. The useful move in any family is one that leaves its normal range and stays out, read on a fixed schedule from primary sources. Everything else in the macro news flow is context.
How Do Credit Spreads Affect Asset Allocation?
Credit spreads, the yield gap between corporate bonds and similar-maturity Treasurys, price what lenders demand to fund businesses. When spreads widen and stay wide, refinancing gets harder and equity risk can change before earnings confirm it. That’s why a persistent spread move outranks most economic releases in a weighted framework.
How Often Should I Change My Asset Allocation?
Rarely, and on a schedule rather than on impulse. A monthly review with a persistence rule keeps every data print from becoming a trade, and it leaves a dated record that the process ran even in the months where nothing changed. Most reviews across a cycle correctly end in no change.
Can Valuation Time the Market?
No. Valuation describes what the market already assumes, so it helps size risk relative to what’s priced in. A stretched market multiple can justify tighter risk bands and stricter confirmation from credit and earnings. It can also stay stretched for years without a drawdown arriving on cue.
Why Do the Signals Disagree Most Months?
Signals conflict in most months, and the weighted answer is then “mixed, no change,” which takes discipline to hold. Fast single-name news never belongs in a macro overlay, even when it feels systemic. The weights also reflect Valens’ judgment in the Market Phase Cycle framework. Other approaches weight earnings or trend differently and can still be internally consistent.
The signals, one insight at a time
FA Alpha Daily applies this to one company, metric, or market signal every morning, free for financial advisors.