
What macro signals should investors watch to make better asset allocation decisions?
Quick answer
Four signal families matter. In order of weight, they are credit conditions, earnings growth, momentum and sentiment, and valuation. Read them from primary sources on a fixed schedule, and change allocation only when a heavily weighted signal moves outside its normal range and stays there.
Credit leads, earnings confirm, sentiment matters only at extremes, and valuation tells you what’s priced in rather than when anything changes.
Most macro data explains the past. Separate the few signals that lead from the many that describe what already happened. Valens Research’s Market Phase Cycle framework ranks them by weight. Credit conditions carry 55%, earnings growth 30%, momentum and sentiment 10%, and valuation 5%. In its August 2026 monitor, the framework read rising Treasury yields as borrower demand for credit rather than inflation fear. The order is the insight. It keeps one loud data release from steering the whole portfolio.
| Signal family | Weight | What justifies an allocation change | What to ignore |
|---|---|---|---|
| Credit conditions | 55% | Spreads break their recent range and stay wider for weeks | A single-day wobble or one weak auction |
| Earnings growth | 30% | A broad slowdown in Uniform earnings that persists across quarters | One season’s margin noise, or as-reported distortions |
| Momentum and sentiment | 10% | Positioning and surveys at an extreme that persists | Routine week-to-week churn |
| Valuation | 5% | Nothing on its own. It sizes risk rather than timing moves | Treating a multiple as a sell signal |
Credit Conditions
Credit spreads are the yield gap between corporate bonds and similar Treasurys. They measure if lenders are getting nervous, and they often move before equity headlines catch up. Track Treasury yields on the Federal Reserve’s daily H.15 release and pair them with a spread series you check on the same day each week. A move matters when spreads break their recent range and stay there for weeks, with investment grade and high yield widening together. Refinancing conditions belong in the same check. When weaker borrowers can still roll their debt cheaply, drawdowns tend to be shallower.
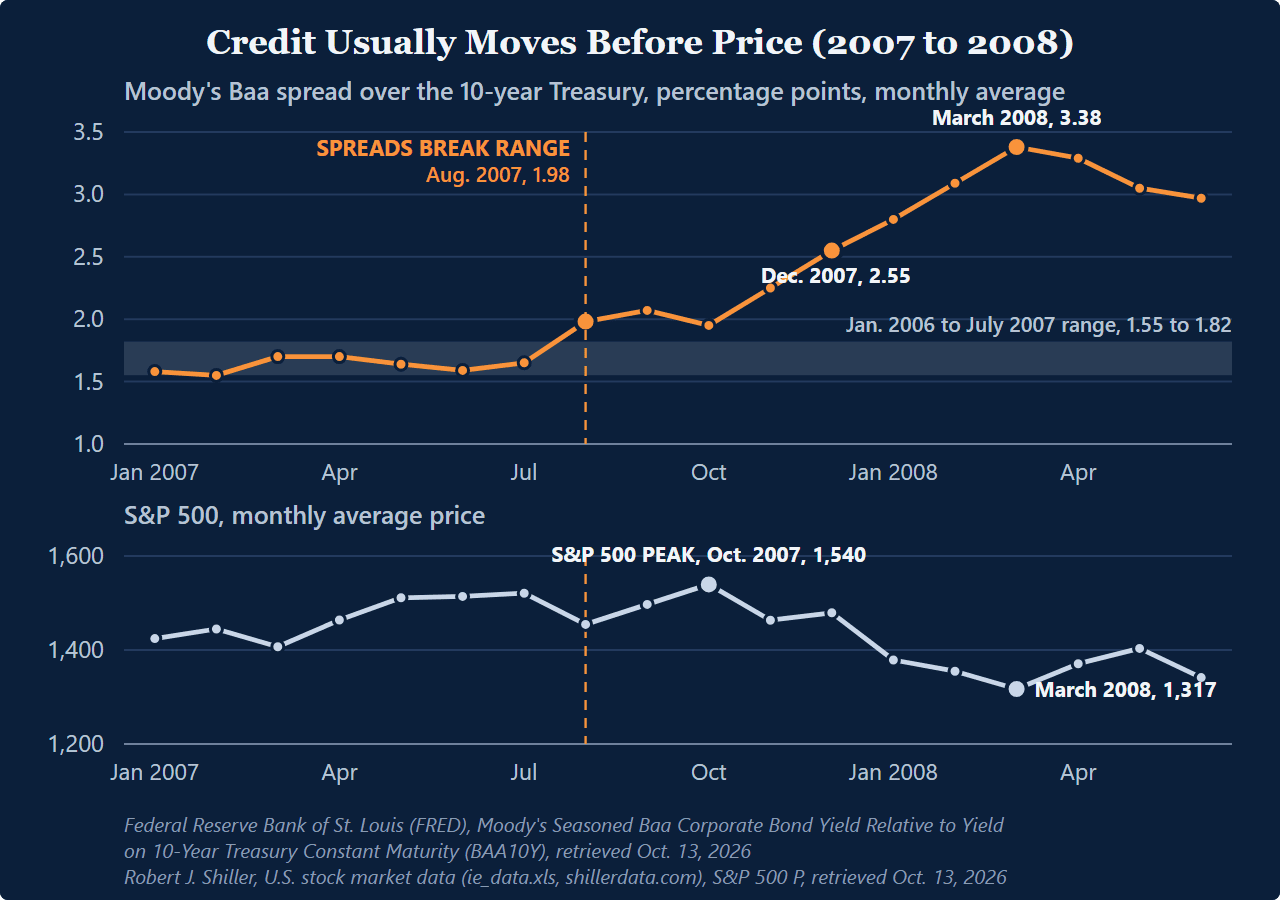
One episode shows the sequence. Moody’s Baa spread over the 10-year Treasury stayed between 1.55 and 1.82 percentage points, by monthly average, from January 2006 through July 2007. In August 2007 it widened to 1.98, outside that range, and it never came back, reaching 2.55 in December 2007 and 3.38 in March 2008. The S&P 500 monthly average price dipped that August, recovered to its peak of 1,540 in October 2007, and had fallen 14.5% to 1,317 by March 2008. The spread broke its range and stayed wide two months before the index peaked. That’s one episode, not a rule about lead times. Figures from the Federal Reserve Bank of St. Louis (FRED), series BAA10Y, and Robert J. Shiller’s S&P 500 data, both retrieved Oct. 13, 2026.
Earnings Growth
Earnings are the confirmation signal. Read aggregate growth on a Uniform basis. As-reported aggregates carry the distortions Uniform Accounting removes, so a clean as-reported quarter can hide a broad slowdown. What matters for allocation is direction and breadth that persist across quarters. One season’s swing is noise. So is a slowdown confined to a single sector while the rest of the market keeps growing.
Momentum and Sentiment
Sentiment earns attention only at extremes. The useful monthly check is a repeatable answer to whether investor sentiment is too bullish, plus a note on how broad participation is. The rest of the time, treat it as background.
Valuation
Valuation tells you what the market already assumes. A yardstick like the Shiller PE can reflect expectations for growth, risk, and the durability of returns. That makes it context for sizing risk. It gets only 5% of the weight because it says little about timing. High multiples can stay high for years.
When the Signals Disagree
Most months, they disagree. Credit can stay calm while sentiment runs hot, and the right answer is then “mixed, no change.” Saying it consistently makes the framework credible in client reviews. Our page on adding macro insight to client meetings covers turning each reading into one client-ready sentence. News about a single company isn’t a macro signal, and it never belongs in this framework. FA Alpha Pulse publishes the monthly Market Phase Cycle reading.
Key points
- Credit carries 55% of the weight, earnings growth 30%, momentum and sentiment 10%, valuation 5%.
- Change an allocation only when a signal breaks its normal range and stays there.
- When the signals disagree, the reading is “mixed, no change.”
- Valuation sizes risk rather than timing it.
The signals, one insight at a time
FA Alpha Daily applies this to one company, metric, or market signal every morning, free for financial advisors.