
How do I know if investor sentiment is too bullish and a short-term sell-off is coming?
Quick answer
No single indicator predicts a sell-off, and extreme optimism can persist for months. The odds of a pullback rise when several sentiment measures hit extremes at once while credit spreads and earnings revisions don’t confirm the optimism. Rebalance on schedule rather than trying to call a top.
The measures to watch are lopsided bull-bear surveys, very low put-call ratios and volatility, record margin debt, low fund-manager cash, and heavy new-issue activity. Treat that combination as a reason to tighten risk rather than as a signal to sell everything.
Sentiment tells you when positioning looks one-sided and the market looks fragile. It doesn’t tell you when a drawdown starts. This page gives you a seven-indicator dashboard, three confirmation checks that matter more than the headline sentiment read, and what to do with the result.
Sentiment Extremes Mean Fragility
When sentiment gets too bullish, positioning is crowded and the market is fragile. When investors agree, the market becomes more sensitive to small disappointments, like a routine earnings miss or a wider credit spread. That’s a statement about fragility rather than valuation, and it still doesn’t time a top.
Clients anchor to recent gains. Then a minor drawdown brings a wave of “should we trim?” emails, and reactive trades follow.
The Seven Sentiment Indicators to Watch
Build a small dashboard you can run the same way each week. A single input can stay stretched for a long time, so you want a cluster that points to one-sided positioning. Low hedging demand in options and subdued volatility, for example, describe the same thing: investors feel little need to protect gains.
For scale, the AAII survey’s long-run average for bearish sentiment is about 31%. When bears run well below that for weeks, it usually isn’t comfort. It’s crowding.
| Indicator | What it measures | When it reads as too bullish |
|---|---|---|
| Investor surveys (AAII, Investors Intelligence) | Self-reported optimism across individuals and newsletter writers | Bulls dominate and bears run well below their long-run range for several weeks |
| Put-call ratio | Options hedging demand (puts) versus speculation (calls) | Unusually low readings: light hedging and heavy call appetite |
| Volatility measures (VIX, implied volatility) | The price of protection in options markets | Volatility stays depressed even as prices rise and headlines turn one-sided |
| Margin debt | Borrowing to buy securities against brokerage collateral | Rapid growth and elevated levels relative to history, which raises forced-selling risk if prices slip |
| Fund-manager cash levels | How much cash active managers hold in reserve | Cash allocations near the low end of their historical range |
| New-issue activity (IPOs, secondaries) | Corporate supply meeting investor demand | A rush of deals with easy demand, often with weaker deal quality getting funded |
| Retail flows | Net buying pressure from individual investors | Persistent inflows and aggressive dip-buying after only minor pullbacks |
Where Sentiment Sits in the Cycle
Sentiment moves in a recognizable sequence, and knowing where you are in it is more useful than any single reading. The Market Phase Cycle framework behind FA Alpha Pulse describes it this way:
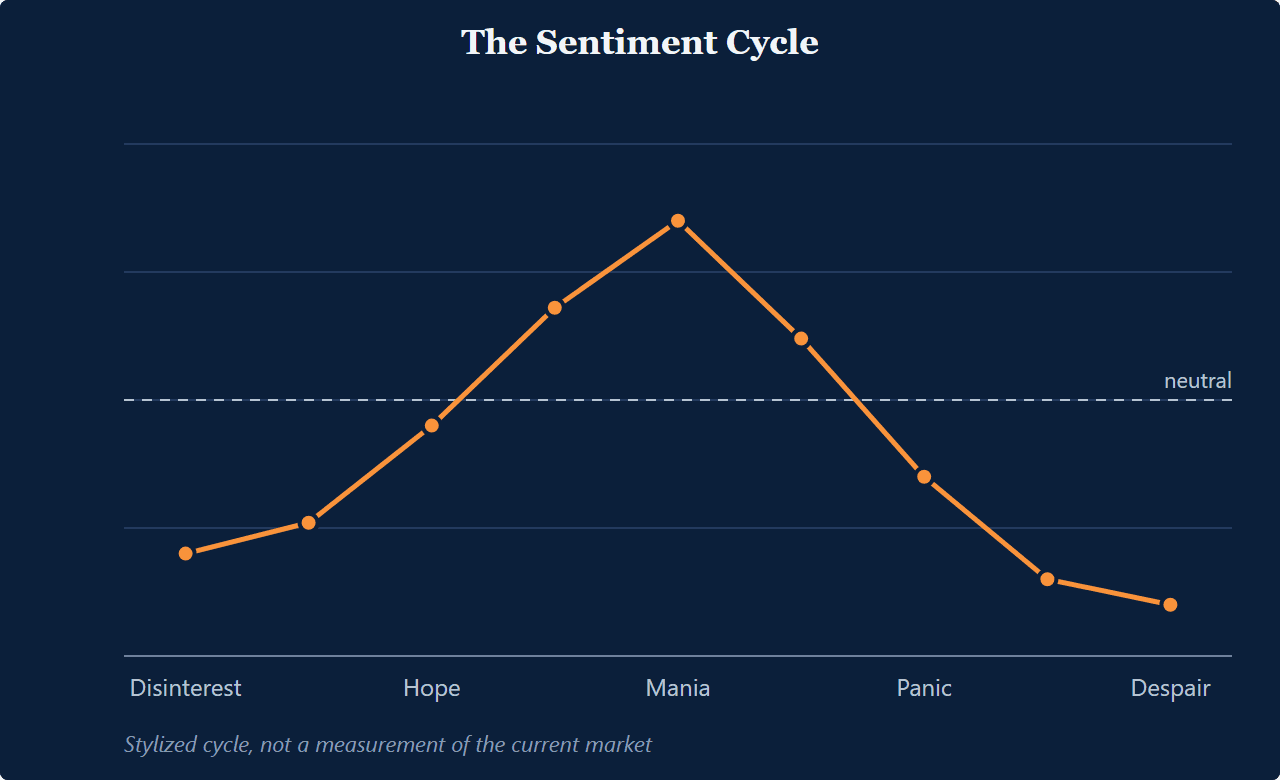
“Too bullish” is the mania phase. Everyone who is going to buy has bought, often with borrowed money, and the market’s support has shifted from earnings to enthusiasm. The sell-off doesn’t come because sentiment is high. It comes when something gives the crowd a reason to reverse, such as an earnings miss, a credit event, or a rate surprise, and there’s no one left to buy the dip.
What Confirms a Sell-Off Risk
A sentiment extreme stops being a headline and becomes a portfolio risk when the confirming checks turn. Spreads usually go first, then revisions, then breadth. Extreme optimism can linger, but it gets more fragile when other markets and fundamentals stop agreeing. Lead with these three checks instead of the headline sentiment read.
1. Credit spreads
Watch whether spreads stay tight as stocks climb. When spreads start widening while equity sentiment stays euphoric, risk appetite in funding markets is fading first. Bond investors tend to reprice risk before stock sentiment shifts.
2. Earnings revisions
Track whether forward estimates and guidance keep improving. If prices and sentiment rise while revisions flatten or turn down, investors are paying up for a story that earnings aren’t backing up.
3. Breadth
Compare index gains to participation. When fewer stocks advance, or the advance-decline line weakens as the index climbs, leadership narrows and a small shock hits the whole market harder.
Translate the Signal Into a Plan
Decide now what you do at extremes, and you’ll make fewer rushed trades. Your rationale will also read like a process note rather than a reaction.
- Don’t call the top. “Sentiment is extreme” is a statement about risk rather than timing. Tell clients the market is more dependent on mood than usual and that you’re managing for it.
- Rebalance on schedule, and let extremes trigger the schedule. If the plan says trim equities back to target when they drift past the band, a mania reading is the moment to do it rather than let it ride.
- Upgrade quality. When sell-offs come, the stocks that fall hardest are the ones held on hope: unprofitable, leveraged, or priced for perfection. Companies with durable Uniform return on assets (“ROA”) and clean balance sheets tend to fall less and recover first.
- Have the drawdown conversation now. The client call to make during mania is the one about what you’ll do when the market falls 15%, so the plan is already agreed when it does.
A client-ready line is: “We’re not calling a top. We’re reducing fragility and preparing for a routine pullback.”
How FA Alpha Tracks This
FA Alpha Pulse monitors the credit, profit, and sentiment signals of the Market Phase Cycle each month. Advisors know which phase the market is in and what usually follows, without trying to time the turn. On the stock side, FA Alpha puts every company in its research on a Uniform Accounting basis, which is how it judges which holdings are supported by underlying earnings and which are supported by the mood. Our page on dead cat bounces covers the other end of the cycle.
Key points
- No single indicator predicts a sell-off, and extreme optimism can persist for months.
- The odds of a pullback rise when several sentiment measures hit extremes at once.
- Watch whether credit spreads and earnings revisions confirm the optimism or don’t.
- Treat that combination as a reason to tighten risk, not as a signal to sell everything.
Signals, not calls, every morning
FA Alpha Daily applies this to one company, metric, or market signal every morning, free for financial advisors.