The last year has led investors on quite the rollercoaster. For investors mostly indexed to the market, the ride has been a relatively smooth journey up. However, it was a different narrative for the next generation of retail investors.
These retail investors united through social media platforms to create movements that attacked traditional market efficiencies through meme stocks.
Just a little less than a year ago, in the midst of the attack of the meme stocks and the rise of the retail investor, we took a look at the fund that was at the heart of it all. To the surprise of some, it wasn’t Citadel, who became a headline name, or any other prominent hedge fund.
Rather it was Melvin Capital who became the original enemy of retail investors. They held positions that were short GameStop (GME) stock, and then took on massive losses as retail investors drove the price up from $10 to nearly $350.
As a result, Melvin Capital nearly had to close its fund for good, and had to take on outside capital to ensure they wouldn’t have to close their doors.
On roughly the anniversary of our initial look at Melvin Capital, we have witnessed a year of the meme stock behind us and potentially the unravelling of the meme stock frenzy.
As the past couple of months have seen the sell off of the high beta names that had been popular with that crowd, it’s worth revisiting the fund at the epicenter of it all.
Melvin Capital’s focus, going back to CEO Gabriel Plotkin’s time at SAC, was around consumer names. In particular, the focus was on companies with a fundamental long-short bent based on quality and valuation.
With that strategy in mind, at the time of its short, the GameStop short position made sense. The company was an expensive turnaround story that didn’t have a high probability of winning. Gamestop’s fundamental headwinds with digital game distribution was a significant headwind as well.
This framework of identifying challenging turnaround stories is consistent with many of the ideas, both long and short, at Melvin still.
So, let’s take a look, a year after the near collapse of Melvin Capital to see if Plotkin and Co. have steadied the ship, or if there are any new big holdings that might not have as strong a position as the team thinks.
Melvin Capital’s goal is to identify firms that are experiencing significant headwinds or tailwinds.
With investments like Live Nation Entertainment (LYV), Hilton Worldwide Holdings (HLT), and Expedia Group (EXPE), the fund has exposure to the travel and entertainment sector that has faced significant headwinds in the past.
On the other hand, the firm also has exposure to several technology firms in Datadog (DDOG), Meta Platforms (FB), and Alphabet (GOOGL) that have all experienced significant price appreciation in the past couple of years.
With such a diverse set of investments, it can become difficult to understand which companies are actually poised to succeed compared to their market pricing.
Economic productivity is massively misunderstood on Wall Street. This is reflected by the 130+ distortions in the Generally Accepted Accounting Principles (GAAP) that make as-reported results poor representations of real economic productivity.
These distortions include the poor capitalization of R&D, the use of goodwill and intangibles to inflate a company’s asset base, a poor understanding of one-off expense line items, and flawed acquisition accounting.
It is no surprise that once many of these distortions are accounted for, it becomes apparent which companies are in reality robustly profitable and which may not be as strong of an investment.
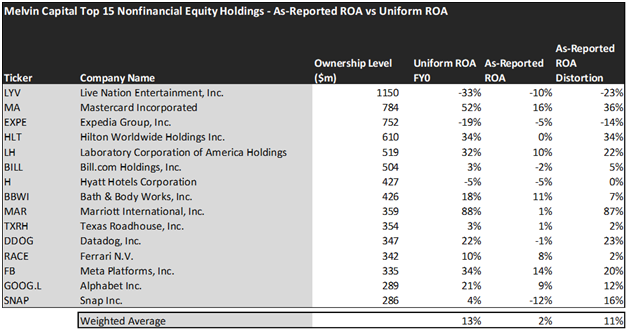
The average as-reported ROA among Melvin Capital’s top 15 names is a concerning 2%, which implies to investors that these companies fail to make back their cost of capital. In reality, these companies perform far better, with a 13% Uniform ROA.
Datadog (DDOG), for example, doesn’t return -1%. It actually boasts a 22% Uniform ROA, more in line with what the average for this sector is.
Similarly, Hilton Worldwide Holdings (HLT) does not have 0% returns. As a lodging firm with a strong history of productivity, it has a 34% Uniform ROA.
These dislocations demonstrate that some of these firms with headwinds today are in a better financial position than GAAP may make their books appear. But there is another crucial step in the search for alpha. Investors need to also find companies that are performing better than their valuations imply.
Valens has built a systematic process called Embedded Expectations Analysis to help investors get a sense of the future performance already baked into a company’s current stock price. Take a look:

This chart shows four interesting data points:
- The Uniform ROA FY0 represents the company’s current return on assets, which is a crucial benchmark for contextualizing expectations.
- The analyst-expected Uniform ROA represents what ROA is forecast to be over the next two years. To get the ROA number, we take consensus Wall Street estimates and we convert them to the Uniform Accounting framework.
- The market-implied Uniform ROA is what the market thinks Uniform ROA is going to be in the three years following the analyst expectations, which for most companies here is 2023, 2024, and 2025. Here, we show the sort of economic productivity a company needs to achieve to justify its current stock price.
- The Uniform P/E is our measure of how expensive a company is relative to its Uniform earnings. For reference, average Uniform P/E across the investing universe is roughly 24x.
Currently, Melvin Capital’s portfolio has an average of 13%, but the analysts expect this to grow all the way to 32%. Meanwhile, the market is wildly bullish, expecting returns to hit 78% over the next five years.
Embedded Expectations Analysis of Melvin Capital paints a clear picture of the fund. With investors’ expectations wildly above what analysts are pricing in, Melvin appears to be overpaying for its portfolio. This is backed up by an average P/E of 69x, almost three times higher than averages.
This just goes to show the importance of valuation in the investing process. Finding firms that are facing significant headwinds and tailwinds is only half of the process. The more important part is understanding how much of the opportunity available has already been priced into the market.
To see a list of companies that have interesting situations that may not have their upside or downside captured yet, the Valens Conviction Long List is the place to look. The conviction list is powered by the Valens database, which offers access to full Uniform Accounting metrics for thousands of companies.
Click here to get access.
Read on to see a detailed tearsheet of the largest holding in Melvin Capital.
SUMMARY and Live Nation Entertainment, Inc. Tearsheet
As Melvin Capital’s largest individual stock holdings, we’re highlighting Live Nation Entertainment, Inc.’s (LYV) tearsheet today.
As our Uniform Accounting tearsheet for Live Nation highlights, its Uniform P/E trades at 225.7x, which is well above the global corporate average of 24.0x and its historical average of 42.0x.
High P/Es require high EPS growth to sustain them. In the case of Live Nation, the company has recently shown a 647% Uniform EPS contraction.
Wall Street analysts provide stock and valuation recommendations that, in general, provide very poor guidance or insight. However, Wall Street analysts’ near-term earnings forecasts tend to have relevant information.
We take Wall Street forecasts for GAAP earnings and convert them to Uniform earnings forecasts. When we do this, Live Nation’s Wall Street analyst-driven forecast is for EPS to decline by 88% and 527% in 2021 and 2022, respectively.
Meanwhile, the company’s earning power is below the long-run corporate averages. However, cash flows and cash on hand are nearly 2x total obligations—including debt maturities and capex maintenance. Moreover, Live Nation’s iCDS is 80bps. Together, these signal low operating and credit risks.
Lastly, Live Nation’s Uniform earnings growth is below its peer averages. However, the company is trading above its average peer valuations.
Best regards,
Joel Litman & Rob Spivey
Chief Investment Strategist &
Director of Research
at Valens Research
This portfolio analysis highlights the same insights we use to power our FA Alpha product. To find out more visit our website.