Most of the hedge funds are recording big losses for this year as they have been investing in companies that were hit by rising rates, supply chain problems, and the Ukraine-Russia war.
Some of them are performing worse than the market, even though they are hedged as the names suggest.
But there are a few that did not hide behind excuses and did not disappoint their investors.
One of these names is BlueCrest Capital Management, founded by Michael Platt and William Reeves in 2000.
The fund allocates its assets between systematic strategies that are based on pattern-spotting computer algorithms and discretionary trades which are made by human-driven decisions.
Micheal Platt believes that aggressive stop-losses are significantly important while managing trades and gives a huge deal to hedging positions.
In his first live interview, he mentioned three things he will not touch which are exposure to banks, peripheral debt risk, and illiquid investments.
His perspective on risk management allowed him to record significant returns while everyone else is panicking.
It seems that this strict approach to trading and his vision for the fund works well for both himself and his investors.
This year the fund has recorded a staggering return of 114% so far, benefitting from trading bonds and commodities amid soaring inflation and rising interest rates.
If the fund can maintain this profitability, 2022 will be its record year.
In this context, let’s see the top holdings of BlueCrest and evaluate their performance using Uniform Accounting.
Economic productivity is massively misunderstood on Wall Street. This is reflected by the 130+ distortions in the Generally Accepted Accounting Principles (GAAP) that make as-reported results poor representations of real economic productivity.
These distortions include the poor capitalization of R&D, the use of goodwill and intangibles to inflate a company’s asset base, a poor understanding of one-off expense line items, as well as flawed acquisition accounting.
It’s no surprise that once many of these distortions are accounted for, it becomes apparent which companies are in real robust profitability and which may not be as strong of an investment.
See for yourself below.
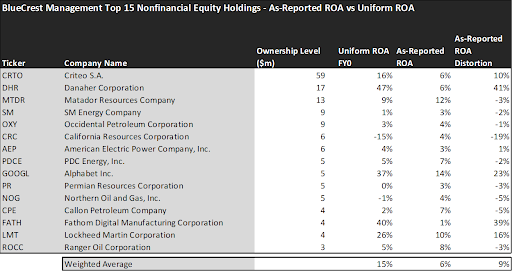
Looking at as-reported accounting numbers, investors would think that BlueCrest Capital Management is even worse than the corporate average profitability and that their returns are not really rewarding.
On an as-reported basis, many of the companies in the fund are bad performers. The average as-reported ROA for the top 15 holdings of the fund is 6%, which is half of the U.S. corporate average of 12%.
However, once we make Uniform Accounting adjustments to accurately calculate earning power, we can see that the average return in BlueCrest’s top 15 holdings is actually 15%.
As the distortions from as-reported accounting are removed, we can see that Fathom Digital Manufacturing Corporation (FATH) isn’t a 1% return business. Its Uniform ROA is 40%.
Meanwhile, Danaher Corporation (DHR) looks like a 6% return business. This huge $200 billion company provides a diverse set of products and services worldwide, and it actually powers a 47% Uniform ROA.
To find companies that can deliver alpha beyond the market, just finding companies where as-reported metrics misrepresent a company’s real profitability is insufficient.
To really generate alpha, any investor also needs to identify where the market is significantly undervaluing the company’s potential.
These dislocations demonstrate that most of these firms are in a different financial position than GAAP may make their books appear. But there is another crucial step in the search for alpha. Investors need to also find companies that are performing better than their valuations imply.
Valens has built a systematic process called Embedded Expectations Analysis to help investors get a sense of the future performance already baked into a company’s current stock price. Take a look:
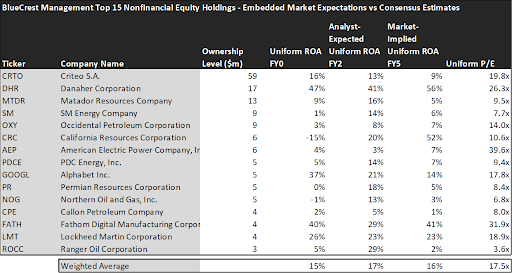
This chart shows four interesting data points:
- The average Uniform ROA among BlueCrest’s top 15 holdings is actually 15% which is just above the corporate average.
- The analyst-expected Uniform ROA represents what ROA is forecasted to do over the next two years. To get the ROA value, we take consensus Wall Street estimates and convert them to the Uniform Accounting framework.
- The market-implied Uniform ROA is what the market thinks Uniform ROA is going to be in the three years following the analyst expectations, which for most companies here are 2023, 2024, and 2025. Here, we show the sort of economic productivity a company needs to achieve to justify its current stock price.
- The Uniform P/E is our measure of how expensive a company is relative to its Uniform earnings. For reference, the average Uniform P/E across the investing universe is roughly 20x.
Embedded Expectations Analysis of BlueCrest paints a clear picture. Over the next few years, Wall Street analysts expect the companies in the fund to stay flat in profitability and the market’s expectations are in line with the analysts.
Analysts forecast the portfolio holdings on average to see Uniform ROA remain around 17% over the next two years. At current valuations, the market agrees with the analysts by expecting a 16% Uniform ROA for the companies in BlueCrest’s portfolio.
For instance, the famous aerospace and defense company Lockheed Martin Corporation (LMT) returned 26% this year. Analysts think its returns will slightly decline to 23%. And at an 18.9x Uniform P/E, the market agrees with analysts’ expectations and is pricing Uniform ROA to be around 23%.
Similarly, Occidental Petroleum Corporation’s (OXY) Uniform ROA is 3%. Analysts are pricing its returns to 8% and the market is pricing its returns to increase to around 7%.
Overall, BlueCrest Capital Management has high-quality names that are overlooked because of the distortions from as-reported metrics. However, the market is already pricing in the expected profitability levels from the companies in BlueCrest’s portfolio, which may lead to some downside risk. That is why it’s highly important for investors to analyze the current valuations and market expectations before any investment decision.
This just goes to show the importance of valuation in the investing process. Finding a company with strong profitability and growth is only half of the process. The other, just as important part, is attaching reasonable valuations to the companies and understanding which have upside which has not been fully priced into their current prices.
To see a list of companies that have great performance and stability also at attractive valuations, the Valens Conviction Long Idea List is the place to look. The conviction list is powered by the Valens database, which offers access to full Uniform Accounting metrics for thousands of companies.
Click here to get access.
Read on to see a detailed tearsheet of one of BlueCrest Capital Management’s largest holdings.
SUMMARY and Criteo S.A. Tearsheet
As one of BlueCrest Capital Management’s largest individual stock holdings, we’re highlighting Criteo S.A.’s (CRTO:USA) tearsheet today.
As the Uniform Accounting tearsheet for Criteo S.A. highlights, its Uniform P/E trades at 19.8x, which is around the global corporate average of 18.4x, and above its historical average of 17.7x.
Low P/Es require low EPS growth to sustain them. That said, in the case of Criteo S.A., the company has recently shown 185% Uniform EPS growth.
Wall Street analysts provide stock and valuation recommendations that, in general, provide very poor guidance or insight. However, Wall Street analysts’ near-term earnings forecasts tend to have relevant information.
We take Wall Street forecasts for GAAP earnings and convert them to Uniform earnings forecasts. When we do this, Criteo S.A.’s Wall Street analyst-driven forecast is for EPS to shrink by 70% in 2022 and grow by 108% in 2023.
Furthermore, the company’s return on assets was 16% in 2021, which is 3x the long-run corporate averages. Also, cash flows and cash on hand consistently exceed its total obligations—including debt maturities and CAPEX maintenance. Moreover, its intrinsic credit risk is 360bps above the risk-free rate. Together, these signal moderate operating risks and moderate credit risks.
Lastly, Criteo S.A.’s Uniform earnings growth is above peer averages, and below peer valuations.
Best regards,
Joel Litman & Rob Spivey
Chief Investment Strategist &
Director of Research
at Valens Research
This portfolio analysis highlights the same insights we share with our FA Alpha Members. To find out more, visit our website.