2022 was a difficult year for the investment management industry.
S&P 500 lost around 20% and many companies dealt with rising interest rates, the Ukraine-Russia war, and global supply chain issues.
During an environment where recessionary concerns are rising, buy-and-hold strategies may not work very well.
In this situation, uncertainty is leading the markets and trying to guess the market’s direction might be too risky.
This is what many funds experienced last year. They focused on the market’s direction and tried to position themselves accordingly, but the ones with the wrong guesses recorded massive losses.
However, there’s one group in the industry that took advantage of this uncertainty and volatility in the market, quant funds.
Quant funds focus on short-term pricing discrepancies in the market rather than trying to guess the market’s direction. With this strategy, they have been able to outperform the market and make money for their investors last year.
When a conversation about quant funds arises, one of the first names that come to mind is Renaissance Technologies.
Under the leadership of the legend Jim Simons, the fund has been able to take advantage of the high volatility in the markets once again.
The fund also had an outstanding success in 2008, it brought a return of 98.2% when the S&P was down 38.5% that year.
Yet, it fell behind its competitors last year even though it did well compared to the market.
While Renaissance’s flagship fund Medallion made around 19% last year, D.E. Shaw’s largest fund rose by 25%, and Citadel’s flagship fund Wellington recorded a staggering return of around 38%.
The relatively bad performance of Renaissance also raises questions about its sky-high fees which take around 5% as management fees and 36% as performance fees.
With these high fees and worse performance in the last year, Renaissance is concerned about the rise of competition.
Let’s see the fund’s top holdings and evaluate if it can rise to the top of the quant space in the upcoming year.
Economic productivity is massively misunderstood on Wall Street. This is reflected by the 130+ distortions in the Generally Accepted Accounting Principles (GAAP) that make as-reported results poor representations of real economic productivity.
These distortions include the poor capitalization of R&D, the use of goodwill and intangibles to inflate a company’s asset base, a poor understanding of one-off expense line items, as well as flawed acquisition accounting.
It’s no surprise that once many of these distortions are accounted for, it becomes apparent which companies are in real robust profitability and which may not be as strong of an investment.
See for yourself below.
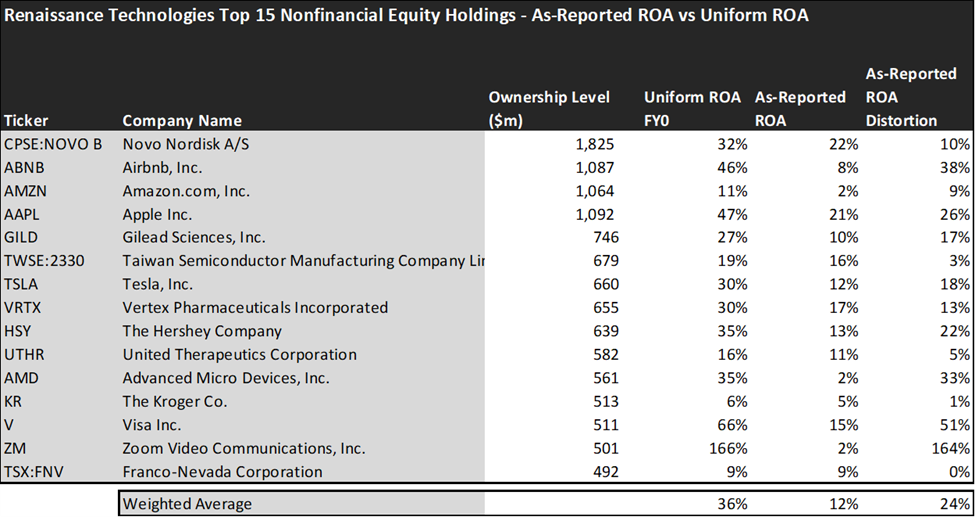
Looking at as-reported accounting numbers, investors would think that investing in Renaissance Technologies is not really rewarding.
On an as-reported basis, many of the companies in the fund are just average performers. The average as-reported ROA for the top 15 holdings of the fund is 12%, which equals the U.S. corporate average.
However, once we make Uniform Accounting adjustments to accurately calculate the earning power, we can see that the average return in Renaissance Technologies’ top 15 holdings is actually 36%.
As the distortions from as-reported accounting are removed, we can see that Zoom Video Communications (ZM) isn’t a 2% return business. Its Uniform ROA is 166%.
Meanwhile, Visa (V) looks like a 15% return business, but this massive financial services company actually powers a 66% Uniform ROA.
To find companies that can deliver alpha beyond the market, just finding companies where as-reported metrics misrepresent a company’s real profitability is insufficient.
To really generate alpha, any investor also needs to identify where the market is significantly undervaluing the company’s potential.
These dislocations demonstrate that most of these firms are in a different financial position than GAAP may make their books appear. But there is another crucial step in the search for alpha. Investors need to also find companies that are performing better than their valuations imply.
Valens has built a systematic process called Embedded Expectations Analysis to help investors get a sense of the future performance already baked into a company’s current stock price. Take a look:
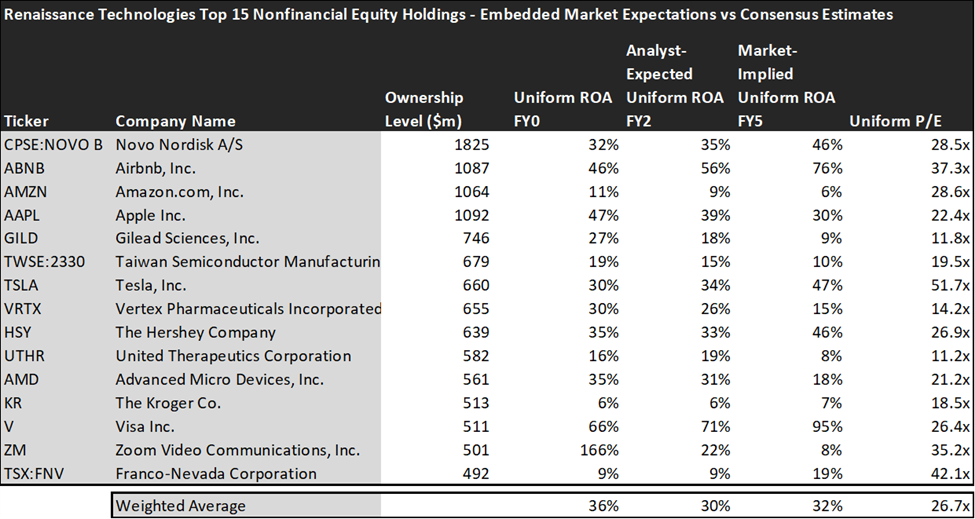
This chart shows four interesting data points:
- The average Uniform ROA among Renaissance Technologies’ top 15 holdings is actually 36% which is much better than the corporate average in the United States.
- The analyst-expected Uniform ROA represents what ROA is forecasted to do over the next two years. To get the ROA value, we take consensus Wall Street estimates and convert them to the Uniform Accounting framework.
- The market-implied Uniform ROA is what the market thinks Uniform ROA is going to be in the three years following the analyst expectations, which for most companies here are 2023, 2024, and 2025. Here, we show the sort of economic productivity a company needs to achieve to justify its current stock price.
- The Uniform P/E is our measure of how expensive a company is relative to its Uniform earnings. For reference, the average Uniform P/E across the investing universe is roughly 20x.
Embedded Expectations Analysis of Renaissance Technologies paints a clear picture. Over the next few years, Wall Street analysts expect the companies in the fund to slightly decline in profitability, and the market agrees.
Analysts forecast the portfolio holdings on average to see Uniform ROA decline to 30% over the next two years. At current valuations, the market’s expectations are in line with analysts and it expects a 32% Uniform ROA for the companies in the portfolio.
For instance, Amazon (AMZN) returned 11% this year. Analysts think its returns will fall slightly to 9%. And at a 28.6x Uniform P/E, the market also expects a decline in profitability and is pricing Uniform ROA to be around 6%.
Similarly, Apple’s (AAPL) Uniform ROA is 47%. Analysts expect its returns will drop to 39%, but the market is slightly more pessimistic and pricing its returns to fall to 30%.
Overall, Renaissance Technologies have well-regarded and industry-leading names on its portfolio. Low market expectations for its top holdings might be an advantage and help the fund to catch up with its competitors. However, investors shouldn’t get too excited to make an investment decision and should be highly attentive while analyzing valuation and the market’s expectations.
This just goes to show the importance of valuation in the investing process. Finding a company with strong profitability and growth is only half of the process. The other, just as important part, is attaching reasonable valuations to the companies and understanding which have upside which has not been fully priced into their current prices.
To see a list of companies that have great performance and stability also at attractive valuations, the Valens Conviction Long Idea List is the place to look. The conviction list is powered by the Valens database, which offers access to full Uniform Accounting metrics for thousands of companies.
Click here to get access.
Read on to see a detailed tearsheet of one of Renaissance Technologies’ largest holdings.
SUMMARY and Novo Nordisk A/S Tearsheet
As one of Renaissance Technologies’ largest individual stock holdings, we’re highlighting Novo Nordisk A/S (NOVO B:DNK) tearsheet today.
As the Uniform Accounting tearsheet for Novo Nordisk A/S highlights, its Uniform P/E trades at 28.5x, which is above the global corporate average of 18.4x, and its historical average of 25.5x.
High P/Es require high EPS growth to sustain them. In the case of Novo Nordisk A/S, the company has recently shown 28% Uniform EPS growth.
Wall Street analysts provide stock and valuation recommendations that, in general, provide very poor guidance or insight. However, Wall Street analysts’ near-term earnings forecasts tend to have relevant information.
We take Wall Street forecasts for GAAP earnings and convert them to Uniform earnings forecasts. When we do this, Novo Nordisk A/S’s Wall Street analyst-driven forecast is for EPS to grow by 23% and 12% in 2023 and 2024, respectively.
Furthermore, the company’s return on assets was 32% in 2022, which is 5x the long-run corporate averages. Also, cash flows and cash on hand consistently exceed its total obligations—including debt maturities and CAPEX maintenance. Moreover, its intrinsic credit risk is 10bps above the risk-free rate. Together, these signal low dividend risks and low credit risks.
Lastly, Novo Nordisk A/S’s Uniform earnings growth is above peer averages, and in line with peer valuations.
Best regards,
Joel Litman & Rob Spivey
Chief Investment Strategist &
Director of Research
at Valens Research
This portfolio analysis highlights the same insights we share with our FA Alpha Members. To find out more, visit our website.