Greenlight Capital was one of the most successful hedge funds in 2022. In a year when the market was down, Greenlight managed to return 37%. That broke its all-time record from 2001.
Considering the S&P 500 was down at about 19%, and it had never done numbers like that before, this was pretty incredible.
Greenlight was founded by David Einhorn in 1996 and became highly renowned in the investment industry for its short selling of Lehman Brothers prior to the collapse in 2008.
Einhorn describes the fund as a long/short value-oriented hedge fund. Its value investing strategies have made it highly successful, especially in downturns.
Specifically, the fund is highly talented and successful in identifying bubbles in financial markets. It made extraordinary returns in both the 2001 and 2008 downturns and now broke its record with another downturn in 2022.
The way the fund identifies bubble stocks is by performing a traditional valuation analysis to find companies it thinks could fall by 80% or more. Greenlight calls this a “bubble basket” strategy, where it holds a basket of the companies it identifies.
However, due to the bull market that we have seen between 2009 and 2021, its bubble basket strategy did not work well. The fund was either too early or could not successfully identify opportunities.
It introduced and closed three different bubble baskets since 2014, which led it to underperform the market for some years and lose many investors.
2022 was the year Greenlight was looking for. The fund re-introduced another bubble basket in March 2021 just after closing one in January of the same year.
Its persistence brought massive returns—its bubble basket strategy made 30% in gross returns while its value-oriented long strategy accompanied the overall success by gaining 2%.
Today, we’ll look at the fund’s top long-oriented holdings using Uniform Accounting to see if it can continue this success in the upcoming year.
Economic productivity is massively misunderstood on Wall Street. This is reflected by the 130+ distortions in the Generally Accepted Accounting Principles (GAAP) that make as-reported results poor representations of real economic productivity.
These distortions include the poor capitalization of R&D, the use of goodwill and intangibles to inflate a company’s asset base, a poor understanding of one-off expense line items, as well as flawed acquisition accounting.
It’s no surprise that once many of these distortions are accounted for, it becomes apparent which companies are in real robust profitability and which may not be as strong of an investment.
See for yourself below.
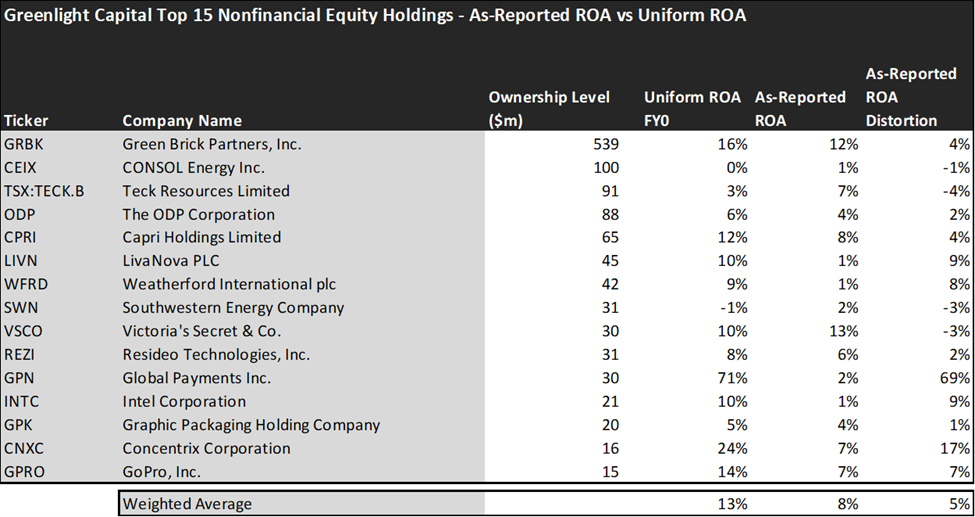
Looking at as-reported accounting numbers, Greenlight’s long investments are a mixed bag.
On an as-reported basis, many of the companies in the fund are poor performers. The average as-reported ROA for the top 15 holdings of the fund is 8%, which is below the U.S. corporate average of 12%.
However, once we make Uniform Accounting adjustments to accurately calculate the earning power, we can see that the average return in Greenlight Capital’s top 15 holdings is actually 13%.
As the distortions from as-reported accounting are removed, we can see that Concentrix Corporation (CNXC) isn’t a 7% return business. Its Uniform ROA is 24%.
Meanwhile, LivaNova (LIVN) looks like a 1% return business, but this medical device manufacturer actually powers a 9% Uniform ROA.
To find companies that can deliver alpha beyond the market, just finding companies where as-reported metrics misrepresent a company’s real profitability is insufficient.
To really generate alpha, any investor also needs to identify where the market is significantly undervaluing the company’s potential.
These dislocations demonstrate that most of these firms are in a different financial position than GAAP may make their books appear. But there is another crucial step in the search for alpha. Investors need to also find companies that are performing better than their valuations imply.
Valens has built a systematic process called Embedded Expectations Analysis to help investors get a sense of the future performance already baked into a company’s current stock price. Take a look:

This chart shows four interesting data points:
- The average Uniform ROA among Greenlight Capital’s top 15 holdings is actually 13% which is slightly better than the corporate average in the United States.
- The analyst-expected Uniform ROA represents what ROA is forecasted to do over the next two years. To get the ROA value, we take consensus Wall Street estimates and convert them to the Uniform Accounting framework.
- The market-implied Uniform ROA is what the market thinks Uniform ROA is going to be in the three years following the analyst expectations, which for most companies here are 2023, 2024, and 2025. Here, we show the sort of economic productivity a company needs to achieve to justify its current stock price.
- The Uniform P/E is our measure of how expensive a company is relative to its Uniform earnings. For reference, the average Uniform P/E across the investing universe is roughly 20x.
Embedded Expectations Analysis of Greenlight Capital paints a clear picture. Over the next few years, Wall Street analysts expect the companies in the fund to stay flat in terms of profitability. However, the market’s expectations are not in line with analysts, and it expects a significant decline in profitability.
Analysts forecast the portfolio holdings on average to see Uniform ROA stay flat at around 14% over the next two years. At current valuations, the market disagrees with the analysts and expects an 8% Uniform ROA for the companies in the portfolio.
For instance, Green Brick Partners (GRBK) returned 16% this year. Analysts think its returns will remain around these levels and reach 15%. And at a 10.8x Uniform P/E, the market expects a significant decline in profitability and is pricing Uniform ROA to be around 5%.
Similarly, Global Payments’ (GPN) Uniform ROA is 71%. Analysts expect its returns to slightly decline to around 66% but the market is pricing its returns for a much deeper decline to 36%.
Overall, Greenlight Capital has a well-positioned portfolio for its value investing strategy. However, the firm’s success is highly concentrated in its bubble baskets and it can carry some risk for investors due to the volatility in financial markets. If an investor wants to be exposed to a value-centric short portfolio Greenlight might be a good place but investors should analyze the current valuations and decide whether to take the risk of shorting or not.
This just goes to show the importance of valuation in the investing process. Finding a company with strong profitability and growth is only half of the process. The other, just as important part, is attaching reasonable valuations to the companies and understanding which have upside which has not been fully priced into their current prices.
To see a list of companies that have great performance and stability also at attractive valuations, the Valens Conviction Long Idea List is the place to look. The conviction list is powered by the Valens database, which offers access to full Uniform Accounting metrics for thousands of companies.
Click here to get access.
Read on to see a detailed tearsheet of one of Greenlight Capital’s largest holdings.
SUMMARY and Green Brick Partners, Inc. Tearsheet
As one of Greenlight Capital’s largest individual stock holdings, we’re highlighting Green Brick Partners, Inc.’s (GRBK:USA) tearsheet today.
As the Uniform Accounting tearsheet for Green Brick Partners, Inc. highlights, its Uniform P/E trades at 10.8x, which is below the global corporate average of 18.4x, but above its historical average of 8.6x.
Low P/Es require low EPS growth to sustain them. That said, in the case of Green Brick Partners, Inc., the company has recently shown 71% Uniform EPS growth.
Wall Street analysts provide stock and valuation recommendations that, in general, provide very poor guidance or insight. However, Wall Street analysts’ near-term earnings forecasts tend to have relevant information.
We take Wall Street forecasts for GAAP earnings and convert them to Uniform earnings forecasts. When we do this, Green Brick Partners, Inc.’s Wall Street analyst-driven forecast is for EPS to grow by 73% in 2022 and shrink by 55% in 2023.
Furthermore, the company’s return on assets was 16% in 2021, which is 3x the long-run corporate averages. Also, cash flows and cash on hand consistently exceed its total obligations—including debt maturities and CAPEX maintenance. Moreover, its intrinsic credit risk is 70bps above the risk-free rate. Together, these signal low operating risks and low credit risks.
Lastly, Green Brick Partners, Inc.’s Uniform earnings growth is above peer averages, and below peer valuations.
Best regards,
Joel Litman & Rob Spivey
Chief Investment Strategist &
Director of Research
at Valens Research
This portfolio analysis highlights the same insights we share with our FA Alpha Members. To find out more, visit our website.