Investors and industry experts frequently discuss the race for dominance in the electric vehicle (“EV”) industry. Tesla (TSLA) was early to the game, and it has garnered a lot of attention as a result.
However, people often overlook the other side of what Tesla does, its self-driving technology.
This technology has the potential to be just as disruptive and transformative for the automotive and transportation industries. Yet, it doesn’t receive as much attention as EVs.
Tesla is often seen as the leader in this technology with their autopilot system being one of the most advanced on the market.
However, other companies are also investing heavily and are making significant strides in this area as well.
For instance, Mercedes (XTRA:MBG) was the first to introduce Autonomous Driving Level 3 technology, surpassing Tesla’s Level 2 system.
Level 2 uses technology like adaptive cruise control (meaning it can change speeds), lane assist, and emergency braking. Theoretically, drivers are still supposed to be watching the road, ready to step in at any time.
With Level 3, drivers are supposed to be able to change their focus under certain circumstances. For instance, Mercedes’ technology will take over for the driver on the highway when driving under a certain speed.
We’re still years away from fully autonomous driving (which is considered Level 5), but clearly, the arms race is heating up.
This development marked a significant step forward for the automotive industry, and other companies are now following suit.
There are many benefits of self-driving technology to the transportation industry. Self-driving cars have the potential to reduce traffic congestion, reduce the cost of transportation, reduce emissions, and improve the overall efficiency of transportation.
Companies that can deliver a safe and reliable self-driving vehicle are likely to have a significant advantage over their competitors. As such, it is essential for investors to track the progress of different companies in this area.
The competition is intense between companies to develop self-driving technology and the potential rewards are vast.
For investors, it might be difficult to predict who will win this race. That is why diversifying investments to a group of companies that work in this space could be a good way to be exposed to this technology.
In light of this, iShares Self-Driving EV and Tech ETF provide that exact opportunity. Therefore, we will have a look at the top holdings in this ETF and evaluate the portfolio from the Uniform Accounting perspective.
Valens has built a systematic process called Embedded Expectations Analysis to help investors get a sense of the future performance already baked into a company’s current stock price. Take a look
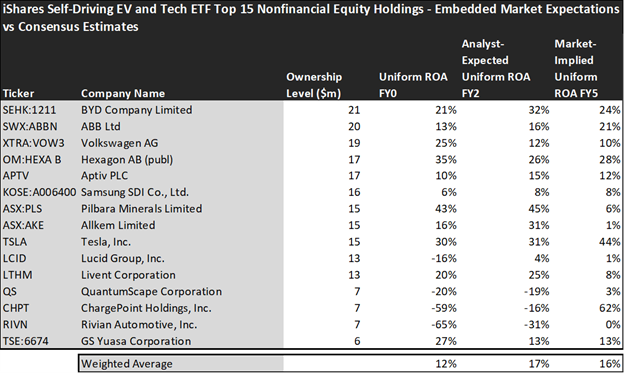
This chart shows four interesting data points:
- The average Uniform ROA among iShares Self-Driving EV and Tech ETF’s top 15 holdings is actually 12%, which is in line with the US corporate average.
- The analyst-expected Uniform ROA represents what ROA is forecasted to do over the next two years. To get the ROA value, we take consensus Wall Street estimates and convert them to the Uniform Accounting framework.
- The market-implied Uniform ROA is what the market thinks Uniform ROA is going to be in the three years following the analyst expectations, which for most companies here are 2023, 2024, and 2025. Here, we show the sort of economic productivity a company needs to achieve to justify its current stock price.
- The Uniform P/E is our measure of how expensive a company is relative to its Uniform earnings. For reference, the average Uniform P/E across the investing universe is roughly 20x.
Embedded Expectations Analysis of iShares Self-Driving EV and Tech ETF paints a clear picture. Over the next few years, Wall Street analysts expect the companies in the fund to significantly increase their profitability. The market agrees with analysts and it is a little bit more optimistic.
Analysts forecast the portfolio holdings on average to see Uniform ROA improve to 17% over the next two years. The market’s expectations are slightly lower than analysts and it expects a 16% Uniform ROA for the companies in the portfolio.
For instance, BYD Company (SEHK:1211) returned 21% this year. Analysts think its returns will rise to 32% in the next two years. While the market expectations on the company’s profitability are lower than analysts and it is pricing Uniform ROA to be around 24%.
Similarly, ABB’s (SWX:ABBN) Uniform ROA is 13%. Analysts expect its returns will improve to 16%, but the market has slightly more optimistic views on the company and pricing its returns to be around 21%.
As we already mentioned, self-driving technology has the potential to disrupt the future of automotive and transportation industries but the market’s expectations are pretty high for these companies.
It means that the market is already pricing in the expected developments in the industry. Because of that, investors should be very careful in analyzing current valuations and the market’s expectations before making any investment decisions.
In this situation, investors may want to look elsewhere to be exposed to this technology or wait for the market’s expectations and valuations to cool down for the companies in the ETF.
This just goes to show the importance of valuation in the investing process. Finding a company with strong profitability and growth is only half of the process. The other, just as important part, is attaching reasonable valuations to the companies and understanding which have upside which has not been fully priced into their current prices.
To see a list of companies that have great performance and stability also at attractive valuations, the Valens Conviction Long Idea List is the place to look. The conviction list is powered by the Valens database, which offers access to full Uniform Accounting metrics for thousands of companies.
Click here to get access.
Read on to see a detailed tearsheet of one of iShares Self-Driving EV and Tech ETF’s largest holdings.
SUMMARY and BYD Company Limited Tearsheet
As one of iShares Self-Driving EV and Tech ETF’s largest individual stock holdings, we’re highlighting BYD Company Limited (1211:HKG) tearsheet today.
As the Uniform Accounting tearsheet for BYD Company Limited highlights, its Uniform P/E trades at 20.5x, which is above the global corporate average of 18.4x, but below its historical average of 36.7x.
High P/Es require high EPS growth to sustain them. In the case of BYD Company Limited, the company has recently shown 321% Uniform EPS shrinkage.
Wall Street analysts provide stock and valuation recommendations that, in general, provide very poor guidance or insight. However, Wall Street analysts’ near-term earnings forecasts tend to have relevant information.
We take Wall Street forecasts for GAAP earnings and convert them to Uniform earnings forecasts. When we do this, BYD Company Limited’s Wall Street analyst-driven forecast is for EPS to grow by 49% and 25% in 2023 and 2024, respectively.
Furthermore, the company’s return on assets was 21% in 2022, which is 3x of the long-run corporate averages. Also, cash flows and cash on hand consistently exceed its total obligations—including debt maturities and CAPEX maintenance. Moreover, its intrinsic credit risk is 60bps above the risk-free rate. Together, these signal low dividend risks and low credit risks.
Lastly, BYD Company Limited’s Uniform earnings growth is in line with peer averages, and above peer valuations.
Best regards,
Joel Litman & Rob Spivey
Chief Investment Strategist &
Director of Research
at Valens Research
This portfolio analysis highlights the same insights we share with our FA Alpha Members. To find out more, visit our website.