FA Alpha Daily:
Wednesday Credit
Powered by Valens Research
It’s easy to think that stable businesses are boring and do not provide high growth prospects for investors.
However, shareholder returns are not just all about high growth and investing in new and fancy trends.
Stable and boring businesses may provide significant returns for their investors as well. TriNet Group (TNET) is one of the best representatives of this.
The company primarily provides payroll administration services to small and medium enterprises. It is a sleepy but vital business, and also highly stable.
The business is not subject to high volatility considering how much employment really moves, even when we talk about a spike in unemployment.
No one wants to deal with limited volatility as it’s boring, so the companies that take on this responsibility are very valuable.
TriNet for example, enjoys high profitability in taking on these tasks. The company has enjoyed increasing profitability in the last few years.
The return on assets (ROA) of this boring business has jumped from 38% in 2020 to 70% in 2022. It’s an incredible growth in profitability.
However, rating agencies like S&P seem to miss these facts and rate it with a 10% chance of bankruptcy. It’s unbelievable considering the rising profitability and the overall stability of the business.
We can figure out if there is a real risk for this company by leveraging the Credit Cash Flow Prime (“CCFP”) to understand the company’s obligations matched against its cash and cash flows.
In the chart below, the stacked bars represent the firm’s obligations each year for the next five years. These obligations are then compared to the firm’s cash flow (blue line) as well as the cash on hand available at the beginning of each period (blue dots) and available cash and undrawn revolver (blue triangles).
The CCFP chart clearly shows that TriNet Group’s cash flows are more than enough to cover its obligations going forward.
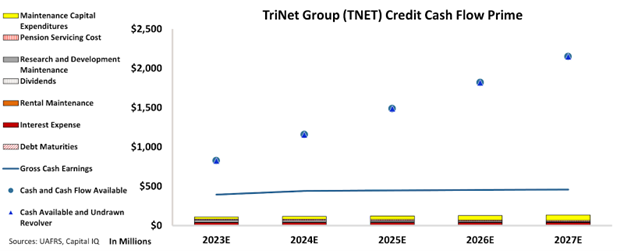
CCFP chart indicates that the company has no significant debt maturities over the next few years.
Additionally, it should have no problems paying down its obligations with the massive cash on hand it currently has.
Taking these factors into account, TriNet Group does not look like it has an imminent risk of defaults as suggested by rating agencies.
This is why, here at Valens, we think that the company is much safer and we rate it “IG3”. This rating implies only around a 1% chance of default and places the company in the investment grade basket, as opposed to S&P’s recommendation of high yield.
It is our goal to bring forward the real creditworthiness of companies, built on the back of better Uniform Accounting.
To see Credit Cash Flow Prime ratings for thousands of companies, click here to learn more about the various subscription options now available for the full Valens Database.
SUMMARY and TriNet Group (TNET:USA) Tearsheet
As the Uniform Accounting tearsheet for TriNet Group (TNET:USA) highlights, the Uniform P/E trades at 16.4x, which is below the global corporate average of 18.4x but above its historical P/E of 14.4x.
Low P/Es require low EPS growth to sustain them. In the case of TriNet Group, the company has recently shown a 13% Uniform EPS growth.
Wall Street analysts provide stock and valuation recommendations that in general provide very poor guidance or insight. However, Wall Street analysts’ near-term earnings forecasts tend to have relevant information.
We take Wall Street forecasts for GAAP earnings and convert them to Uniform earnings forecasts. When we do this, TriNet Group’s Wall Street analyst-driven forecast is for a -31% and 12% EPS growth in 2023 and 2024, respectively.
Based on the current stock market valuations, we can use earnings growth valuation metrics to back into the required growth rate to justify TriNet Group’s $80 stock price. These are often referred to as market embedded expectations.
Furthermore, the company’s earning power in 2022 was 12x the long-run corporate average. Moreover, cash flows and cash on hand are 8x its total obligations—including debt maturities and capex maintenance. The company also has an intrinsic credit risk that is 240bps above the risk-free rate.
Overall, this signals a moderate credit risk.
Lastly, TriNet Group’s Uniform earnings growth is below its peer averages and is trading above its average peer valuations.
Best regards,
Joel Litman & Rob Spivey
Chief Investment Strategist &
Director of Research
at Valens Research
This analysis of TriNet Group (TNET) credit outlook is the same type of analysis that powers our macro research detailed in the member-exclusive FA Alpha Pulse.