While Esports has been around for 50 years, it’s seeing tremendous growth recently due to the gaining popularity of online streaming services. Today’s FA Alpha Daily will highlight VanEck Video Gaming and Esports ETF (ESPO) under the lens of Uniform Accounting.
FA Alpha Daily:
Friday Portfolio Analysis
Powered by Valens Research
With a history of 50 years, Esports has been evolving alongside the countless developments in computers and the internet.
The earliest known competition took place at Stanford University in 1972 with a grand prize of the year’s subscription to Rolling Stones magazine.
However, Esports gained its first step of popularity through a nationwide arcade video game tournament in Japan, organized by Sega (6460:JPN) in 1974.
In the United States, the earliest large-scale video game competition took place in 1980 with The Space Invaders Championship held by Atari. The competition attracted more than 10,000 participants across the country.
Esports and gaming have been among the most popular hobbies ever since, and the industry grew from 10,000 participants in the 1970s to millions of participants and viewers in the last decade.
The Esports industry has seen massive growth in the last 10 years through the emergence of online streaming services.
Thanks to streaming platforms, the Esports industry has been able to increase its audience and its market size.
On top of that, the growth momentum sped up with the pandemic, as people started to entertain themselves at home.
The Esport market size grew from $970 million in 2020 to $1.28 billion in 2021, a 32% growth in just two years. And the industry is expected to reach a market size of $2.89 billion by 2025.
For those looking to take advantage of the growth opportunity in the Esports market, the VanEck Video Gaming and Esports ETF has been a popular option.
Let’s dive into the portfolio using Uniform Accounting to see if it has been able to profit from the surge in the Esports market.
Economic productivity is massively misunderstood on Wall Street. This is reflected by the 130+ distortions in the Generally Accepted Accounting Principles (GAAP) that make as-reported results poor representations of real economic productivity.
These distortions include the poor capitalization of R&D, the use of goodwill and intangibles to inflate a company’s asset base, a poor understanding of one-off expense line items, as well as flawed acquisition accounting.
It is no surprise that once many of these distortions are accounted for, it becomes apparent which companies are in real robust profitability and which may not be as strong of an investment.
Just as one would expect, there is still merit to investing in companies that combine the power of finance and technology, as the Uniform returns are much stronger than the as-reported metrics dictate.
See for yourself below.
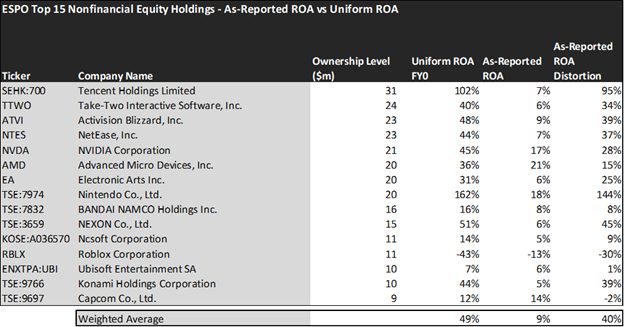
Using as-reported accounting, investors would think investing in the Esports industry would result in the portfolio achieving a weak return on assets (ROA).
On an as-reported basis, many of these companies are poor performers in terms of profitability and operating with an average as-reported ROA of just 9% which equates to below corporate averages in the United States.
However, once we make Uniform Accounting (UAFRS) adjustments to accurately calculate earning power, we can see that the returns of the companies in the VanEck Video Gaming and Esports ETF are much more robust.
The average company in the portfolio displays an impressive average Uniform ROA of 49%, which is around four times the corporate average returns.
Once the distortions from as-reported accounting are removed, we can realize that Tencent Holdings (700:HKG) doesn’t have a ROA of 7%, but returns of 102%.
Similarly, Nexon’s (3659:JPN) ROA is actually 51%, not 6%. Nexon has a successful history in the Esports industry and is now the second-largest game company in South Korea.
Nintendo (7974:JPN) is another great example of as-reported metrics misrepresenting the company’s profitability. With a Uniform ROA of 162%, an as-reported of 18% is wholly misleading and misses the story.
If investors were to look at the industry as powered by as-reported metrics, they would think that Esports is not as profitable as it seems, and all the growth potential of the space is nonsense.
To find companies that can deliver alpha beyond the market, just finding companies where as-reported metrics mis-represent a company’s real profitability is insufficient.
To really generate alpha, any investor also needs to identify where the market is significantly undervaluing the company’s potential.
Those that are thinking to invest in the Esports space should not jump in before considering if it has a strong upside scenario going forward.
Once we account for Uniform Accounting adjustments, we can see that many of these companies are strong stocks but have already realized most of their potential.
These dislocations demonstrate that most of these firms are in a different financial position than GAAP may make their books appear. But there is another crucial step in the search for alpha. Investors need to also find companies that are performing better than their valuations imply.
Valens has built a systematic process called Embedded Expectations Analysis to help investors get a sense of the future performance already baked into a company’s current stock price. Take a look:
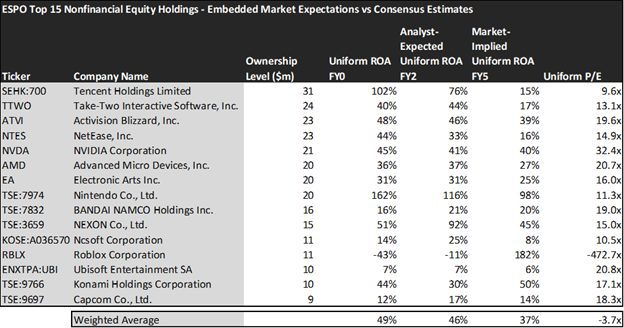
This chart shows four interesting data points:
- The Uniform ROA FY0 represents the company’s current return on assets, which is a crucial benchmark for contextualizing expectations.
- The analyst-expected Uniform ROA represents what ROA is forecasted to do over the next two years. To get the ROA value, we take consensus Wall Street estimates and convert them to the Uniform Accounting framework.
- The market-implied Uniform ROA is what the market thinks Uniform ROA is going to be in the three years following the analyst expectations, which for most companies here is 2023, 2024, and 2025. Here, we show the sort of economic productivity a company needs to achieve to justify its current stock price.
- The Uniform P/E is our measure of how expensive a company is relative to its Uniform earnings. For reference, the average Uniform P/E across the investing universe is roughly 24x.
Embedded Expectations Analysis of VanEck Video Gaming and Esports ETF paints a clear picture of the fund. While the market expects returns to fall slightly, the stocks may be undervalued as analysts expect returns to improve.
While analysts forecast the fund to see Uniform ROA drop to 46% over the next two years, the market is pricing the fund to see returns decrease to 37% levels. This means investors may be presently surprised when the Esports companies are set to overperform.
In particular, there are a couple of companies that may lead investors to be cautious.
Investors expect Tencent Holdings (SEHK:700) to see returns fall to 15%, while analysts are pricing in returns of 76%.
Furthermore, investors have low expectations for NEXON (TSE:3659). They expect the ROA to fall to 45%, while analysts expect it to skyrocket to 92%.
Overall, the portfolio reflects the growth opportunities and high profitability in the surging Esports industry, but the risk that comes with the high growth should not be forgotten.
This just goes to show the importance of valuation in the investing process. Finding a company with strong growth is only half of the process. The other, just as important part, is attaching reasonable valuations to the companies and understanding which have upside which have not been fully priced into their current prices.
To see a list of companies that have great performance and stability also at attractive valuations, the Valens Conviction Long Idea List is the place to look. The conviction list is powered by the Valens database, which offers access to full Uniform Accounting metrics for thousands of companies.
Click here to get access.
Read on to see a detailed tearsheet of VanEck Video Gaming and Esports ETF’s largest holding.
SUMMARY and Tencent Holdings Limited Tearsheet
As Esports ETF’s largest individual stock holding, we’re highlighting the Tencent Holdings Limited (700:HKG) tearsheet today.
As the Uniform Accounting tearsheet for Tencent highlights, its Uniform P/E trades at 9.6x, which is below the global corporate average of 19.7x, but above its historical average of 6.1x.
Low P/Es require low, and even negative, EPS growth to sustain them. In the case of Tencent, the company has recently shown immaterial Uniform EPS growth.
Wall Street analysts provide stock and valuation recommendations that, in general, provide very poor guidance or insight. However, Wall Street analysts’ near-term earnings forecasts tend to have relevant information.
We take Wall Street forecasts for GAAP earnings and convert them to Uniform earnings forecasts. When we do this, Tencent’s Wall Street analyst-driven forecast is for EPS to grow by 42% in 2022 and decline by 12% in 2023.
Based on the current stock market valuations, we can use earnings growth valuation metrics to back into the required growth rate to justify Tencent’s HKD 316 stock price. These are often referred to as market embedded expectations.
The company is currently being valued as if Uniform earnings were to shrink by 8% annually over the next three years. What Wall Street analysts expect for Tencent’s earnings growth is above what the current stock market valuation requires in 2022, but below that requirement in 2023.
Meanwhile, the company’s earning power is 12x the long-run corporate averages. Also, cash flows and cash on hand are nearly 3x the total obligations—including debt maturities and capex maintenance. Moreover, intrinsic credit risk is just 60bps. All in all, these signal low dividend and credit risks.
Lastly, Tencent’s Uniform earnings growth is above peer averages and is trading above its average peer valuations.
Best regards,
Joel Litman & Rob Spivey
Chief Investment Strategist &
Director of Research
at Valens Research
This portfolio analysis highlights the same insights we use to power our FA Alpha product. To find out more visit our website.