Volatility is often a signal for investors to buckle down and brace for dramatic gains and losses.
In recent years, index funds that track broader market indices have become increasingly popular. They offer investors a low-cost option to diversify their assets.
In theory, hedge funds following certain strategies should be able to outperform the market. With the degree of volatility experienced in the market last year, it seems investors began looking for ways to outperform.
The hedge fund industry saw $14 billion of net cash inflow. In particular, this was the year of multi-strategy funds, which experienced an inflow of $21 billion in the past year.
Many potential superstar hedge fund managers are seeing their potential flame out because of a desire for higher risk mitigation.
With tales of caution like Melvin Capital last year, which we talked about last Friday, investors are seeking out multiple strategies to invest in.
“Multi-Strat” funds differ from their peers as they combine several different investment strategies, with a low correlation, in order to provide a more stable return to their investors.
They have layers of control in their investments, yet still combine to provide above-market returns.
As one of the funds that utilize this multi-strategy approach, Millennium Management stands out as a flagship hedge fund. It has experienced only one down year in the past thirty years, with a mere 3% down year in 2008.
We initially discussed Millennium and its manager Izzy Englander last February to hone in on the resiliency of their investment framework. With another year of volatility in the market, let’s reexamine this portfolio through our Uniform Accounting lens.
Millennium Management operates in a manner dissimilar to many of its contemporaries.
Court documents submitted by then New York attorney general Eliot Spitzer in the late 2000s stated that Millennium utilizes a “master feeder” structure. In essence, money is split in smaller sub-funds and these funds are then pooled together into a master fund.
The firm gets a diversification benefit from this strategy and allows them to have many different investments.
With their investments ranging from large technology companies like Microsoft (MSFT), Apple (AAPL), and Amazon.com (AMZN), to more lifestyle staples such as Walmart (WMT) and Coca-Cola (KO), we can see they have a broad investment horizon.
With such a diverse set of investments, it can become difficult to understand which companies are actually poised to succeed compared to their market pricing.
Economic productivity is massively misunderstood on Wall Street. This is reflected by the 130+ distortions in the Generally Accepted Accounting Principles (GAAP) that make as-reported results poor representations of real economic productivity.
These distortions include the poor capitalization of R&D, the use of goodwill and intangibles to inflate a company’s asset base, a poor understanding of one-off expense line items, and flawed acquisition accounting.
It is no surprise that once many of these distortions are accounted for, it becomes apparent which companies are in reality robustly profitable, and which may not be as strong of an investment.
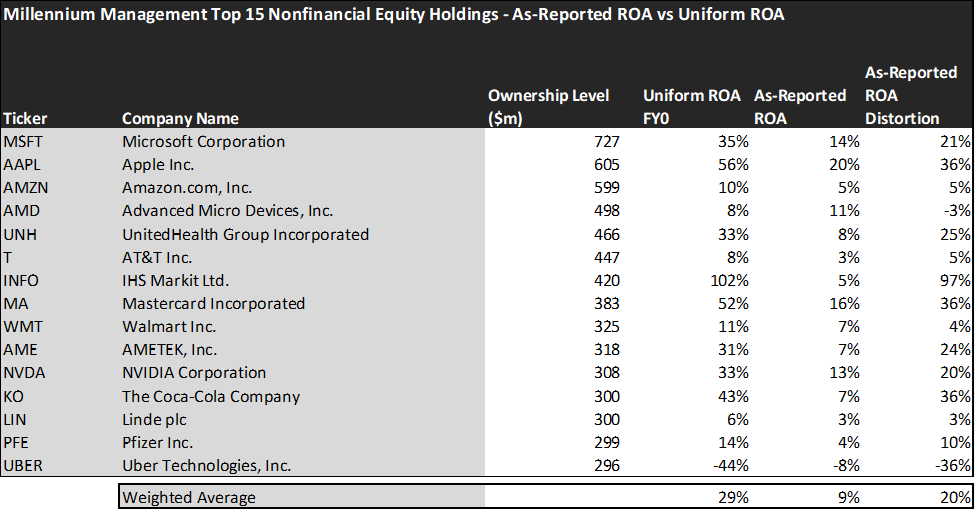
The average as-reported ROA among Melvin Capital’s top 15 names is an average 9%, which is just below the average returns in the market. In reality, these companies perform far better, with a 29% Uniform ROA.
United HealthGroup (UNH), for example, doesn’t return 8%. It actually boasts a 33% Uniform ROA, which is representative of its strong position in the industry.
Similarly, The Coca-Cola Company (KO) does not have 7% returns. As a consumer staples firm with a wide umbrella of products, it has a 43% Uniform ROA.
These dislocations demonstrate that most of these firms are in a stronger financial position than GAAP may make their books appear. But there is another crucial step in the search for alpha. Investors need to also find companies that are performing better than their valuations imply.
Valens has built a systematic process called Embedded Expectations Analysis to help investors get a sense of the future performance already baked into a company’s current stock price. Take a look:
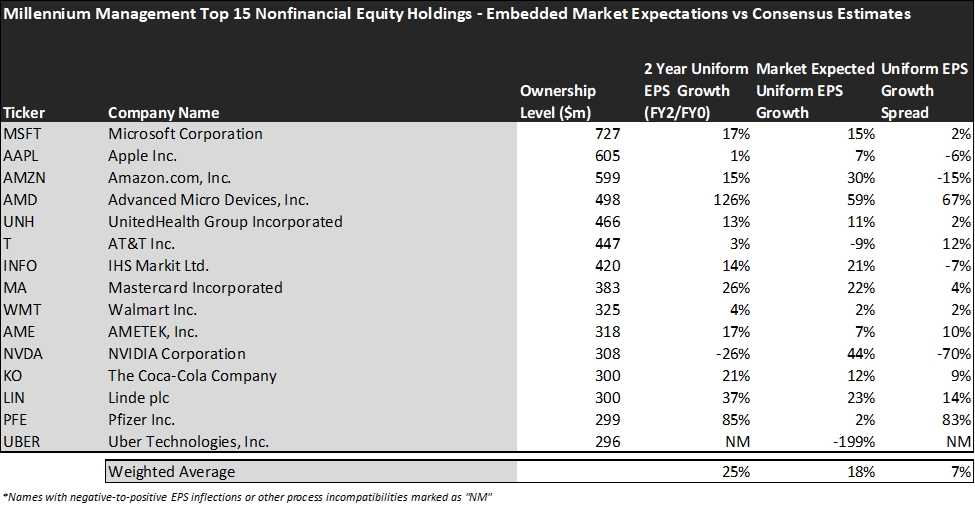
This chart shows three interesting data points:
- The 2-year Uniform EPS growth represents what Uniform earnings growth is forecast to be over the next two years. The EPS number used is the value of when we take consensus Wall Street estimates and we convert them to the Uniform Accounting framework.
- The market expected Uniform EPS growth is what the market thinks Uniform earnings growth is going to be for the next two years. Here, we show by how much the company needs to grow Uniform earnings in the next 2 years to justify the current stock price of the company. If you’ve been reading our daily analyses and reports for a while, you’ll be familiar with the term embedded expectations. This is the market’s embedded expectations for Uniform earnings growth.
- The Uniform EPS growth spread is the spread between how much the company’s Uniform earnings could grow if the Uniform earnings estimates are right, and what the market expects Uniform earnings growth to be.
The average company in the U.S. is forecast to have 5% annual Uniform Accounting earnings growth over the next 2 years. Millennium’s holdings are forecast by the market to grow by 18%.
Meanwhile, analysts are pricing these companies to actually grow earnings by 25% a year on average. While these companies are growing faster than the market, they are intrinsically undervalued, as the market is mispricing their growth by 7%.
These are the kinds of companies that are likely to see their stocks rally when the market realizes growth potential.
One example of a company in Millennium’s portfolio that has growth potential that the market is mispricing is Advanced Micro Devices (AMD). AMD’s analyst forecast a 126% Uniform earnings growth built in, where the market is pricing the company to have earnings only grow by 50% earnings each year for the next two years.
Another company with similar dislocations is Pfizer, Inc. Market expectations call for a 2% growth in earnings. However, the company is actually forecast for Uniform EPS to grow by 85% a year.
For the most part, Millennium Management’s holdings are strong technology and consumer oriented stocks that are undervalued. This wouldn’t be clear under GAAP, but unsurprisingly Uniform Accounting and a system built to deliver alpha see the same signals.
To see a list of companies that have interesting situations that may not have their upside or downside captured yet, the Valens Conviction Long List is the place to look. The conviction list is powered by the Valens database, which offers access to full Uniform Accounting metrics for thousands of companies.
Click here to learn more and get access.
Read on to see a detailed tearsheet of the largest holding in Millennium Management.
SUMMARY and Microsoft Corporation Tearsheet
As Millennium Management’s largest individual stock holdings, we’re highlighting Microsoft Corporation’s (MSFT) tearsheet today.
As the Uniform Accounting tearsheet for Microsoft highlights, its Uniform P/E trades at 27.3x, which is above the global corporate average of 24.0x and its historical average of 25.1x.
High P/Es require high EPS growth to sustain them. In the case of Microsoft, the company has recently shown a 24% Uniform EPS growth.
Wall Street analysts provide stock and valuation recommendations that, in general, provide very poor guidance or insight. However, Wall Street analysts’ near-term earnings forecasts tend to have relevant information.
We take Wall Street forecasts for GAAP earnings and convert them to Uniform earnings forecasts. When we do this, Microsoft’s Wall Street analyst-driven forecast is for EPS to grow by 29% and 10% in 2021 and 2022, respectively.
Based on the current stock market valuations, we can use earnings growth valuation metrics to back into the required growth rate to justify Microsoft’s $300 stock price. These are often referred to as market embedded expectations.
The company is currently being valued as if Uniform earnings were to grow 13% annually over the next three years. What Wall Street analysts expect for Microsoft’s earnings growth is above what the current stock market valuation requires in 2021, but below that requirement in 2022.
Meanwhile, the company’s earning power is 6x the long-run corporate averages. Moreover, cash flows and cash on hand are nearly 4x total obligations—including debt maturities and capex maintenance. Furthemore, Microsoft’s iCDS is 30bps. Together, these signal low dividend and credit risks.
Lastly, Microsoft’s Uniform earnings growth is above its peer averages. However, the company is trading in line with its average peer valuations.
Best regards,
Joel Litman & Rob Spivey
Chief Investment Strategist &
Director of Research
at Valens Research
This portfolio analysis highlights the same insights we use to power our FA Alpha product. To find out more visit our website.