The stock market can witness incredibly low or high valuations of companies.
The interesting thing is that these valuations are sometimes sustainable for long periods, even though they clearly have nothing to do with the underlying business.
This situation might be seen when investors are overexcited about new technologies or when the company is always under the spotlight and at the tip of everybody’s tongues.
However, sooner or later the market realizes the truth, and the bubble bursts.
We see that now with money-losing businesses, which are finally having their reckoning.
One of the biggest of these has been Uber Technologies (UBER) for a very long time.
Uber operates a platform that connects drivers with passengers and other customers. It has been active since 2010 and grew extremely fast to different geographies.
It quickly became the favorite transportation app of many.
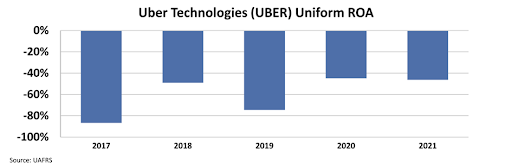
This aggressive growth can also be seen in numbers. The lowest Uniform asset growth the company had during the three years before the pandemic was 46% in 2017. Uber’s assets grew by 54% both in 2018 and 2019.
However, asset growth doesn’t bring in cash. The company never actually managed to be profitable, even after its initial public offering (“IPO”) in 2019.
The Uniform return on assets (“ROA”) of the company was improved from -87% in 2017 to -46% in 2021. The company has been burning the money it has financed through stock and debt issuances all these years.
Strangely, the market has always had positive expectations from Uber. The stock price was $45 on the day of the IPO and surged to $60 in April 2021, which was still an all-time high price for the stock.
Since then, the company has lost more than half of its market capitalization, as the market slowly realizes that this money-losing business will not generate profits soon.
However, even after this huge drop from the top, the market might still be pricing in improvements in profitability.
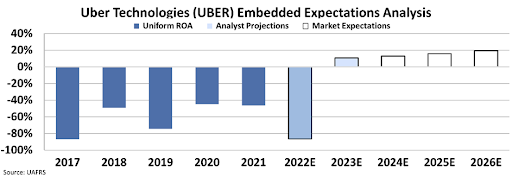
By utilizing our Embedded Expectations Analysis (“EEA”) framework, we can see what investors expect these companies to do at the current stock price.
Stock valuations are typically determined using a discounted cash flow (“DCF”) model, which makes assumptions about the future and produces the “intrinsic value” of the stock.
We know models with garbage-in assumptions based on distorted GAAP metrics only come out as garbage. Therefore, we use the current stock price with our Embedded Expectations Analysis to determine what returns the market expects.
At around $27, the market expects Uber’s Uniform ROA to rise to an astonishing 20% in the next five years. The analyst expectations for 2022 are very pessimistic at -88% ROA, but they are expecting a huge recovery to 11% next year.
Even though the stock has lost lots of value during the last one and a half years, it still seems overvalued.
The funding is drying up, and regulators are squeezing Uber on the other side in terms of benefits and pay for drivers. However, the market is still hopeful.
Investors should always be wary of market expectations before making an investment decision. The EEA framework helps us understand the market and take a position accordingly.
SUMMARY and Uber Technologies, Inc. Tearsheet
As the Uniform Accounting tearsheet for Uber Technologies, Inc. (UBER:USA) highlights, the Uniform P/E trades at -47.9x, which is below the corporate average of 18.4x and its historical P/E of -23.3x.
Negative P/Es only require low EPS growth to sustain them. In the case of Uber Technologies, the company has recently shown a 12% shrinkage in Uniform EPS.
Wall Street analysts provide stock and valuation recommendations that in general provide very poor guidance or insight. However, Wall Street analysts’ near-term earnings forecasts tend to have relevant information.
We take Wall Street forecasts for GAAP earnings and convert them to Uniform earnings forecasts. When we do this, Uber’s Wall Street analyst-driven forecast is a 94% growth and 110% EPS shrinkage in 2022 and 2023, respectively.
Furthermore, the company’s earning power in 2021 is 0.46x the long-run corporate average. Moreover, cash flows and cash on hand are 2.33x its total obligations—including debt maturities, capex maintenance, and dividends. Also, the company’s intrinsic credit risk is 55bps above the risk-free rate.
All in all, this signals low dividend risk.
Lastly, Uber’s Uniform earnings growth is above its peer averages and below its average peer valuations.
Best regards,
Joel Litman & Rob Spivey
Chief Investment Strategist &
Director of Research
at Valens Research
The Uniform Accounting insights in today’s issue are the same ones that power some of our best stock picks and macro research, which can be found in our FA Alpha Daily newsletters.