In today’s volatile market, while many investors adopt a cautious approach, some believe that taking risks can be beneficial in certain situations. In light of key indicators pointing to an economic downturn, this is a perfect time for macro-based hedge funds to thrive and deploy their strategies. One such fund is Graham Capital Management, led by Ken Tropin, which is a dominant macro and trend-following hedge fund. In today’s FA Alpha Daily, we’ll take a closer look at Graham Capital’s top holdings using Uniform Accounting to see if this different technique and investment strategy could show promise in the upcoming years.
FA Alpha Daily:
Friday Portfolio Analysis
Powered by Valens Research
History has shown that the market is quite volatile and unpredictable. With tight lending standards and hiking rates, there have been recent developments of recessionary concerns.
While economic turmoil is worrisome for the future, these periods of uncertainty are what create opportunities for investors all over the world.
Whether it’s an institutional or individual investor, success is driven by one key factor.
Understanding the macro-outlook of the upcoming years…
Positioning is key. Investors that are able to get the macro-outlook correct put themselves in positions to capitalize on market fluctuations.
This principle has acted as the foundation of investment strategies for many. Some are better at it than others.
One that comes to mind is Ken Tropin of Graham Capital Management.
Before founding a firm that would amass over $17 billion in assets under management (“AUM”), Tropin began his financial career deeply rooted in the industry.
He worked for famous investors like John Henry and Paul Tudor Jones.
Upon establishing a steady foundation of investment management through his CEO position at John W. Henry & Company, Ken Tropin decided it was time to launch his own hedge fund.
That is when Graham Capital Management was born.
Coupled with the development of quantitative trading methods to indicate market signals, Ken Tropin slowly built up its reputation as a long-running macro and trend-following manager.
This type of strategy consists of achieving returns through economic or political events, and how those events will impact the markets. Managers will make “bets” on the way a market will change based on these macro-events.
Ken Tropin did precisely that and was wildly successful. Evidenced by the performance of many Graham Quant Macro strategy funds.
Tropin displayed his expertise in post-pandemic 2022 where most funds struggled to turn profits.
The successful prediction of the Fed hiking rates up way beyond consensus projections, to 350 basis points, allowed Graham Capital Management to position itself to capitalize on this market misread.
Graham Capital Management mostly enacted short positions on fixed-income securities, which largely contributed to the company’s ability to post double digits returns in that year.
2022 was a good year for Tropin but the upcoming years may have something else in store. Similar to what we have written about previously, Ken Tropin is concerned about the macro indications of a range-bound market. Or securities trading strictly between its highs and lows in an inconsistent manner.
Graham Capital Management and Ken Tropin may need to adjust their strategy to act accordingly.
This macro-based hedge fund nailed it last year. Let’s take a look at its top holding and see if it can repeat success in the future.
Economic productivity is massively misunderstood on Wall Street. This is reflected by the 130+ distortions in the Generally Accepted Accounting Principles (GAAP) that make as-reported results poor representations of real economic productivity.
These distortions include the poor capitalization of R&D, the use of goodwill and intangibles to inflate a company’s asset base, a poor understanding of one-off expense line items, as well as flawed acquisition accounting.
It’s no surprise that once many of these distortions are accounted for, it becomes apparent which companies are in real robust profitability and which may not be as strong of an investment.
See for yourself below.
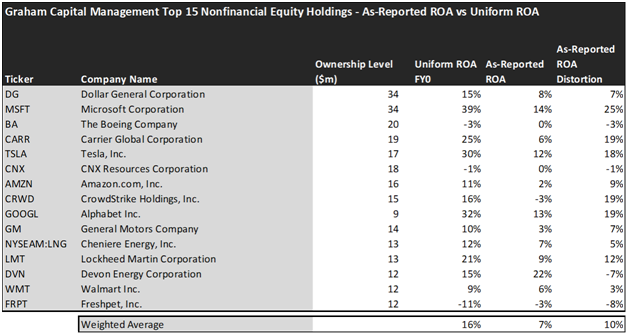
Looking at as-reported accounting numbers, investors would think that Graham Capital Management invests in below-average companies.
On an as-reported basis, many of the companies in the fund are poor performers. The average as-reported ROA for the top 15 holdings of the fund is 7%, which is significantly below the U.S. corporate average.
However, once we make Uniform Accounting adjustments to accurately calculate the earning power, we can see that the average return in Graham Capital Management top 15 holdings is actually 16%.
As the distortions from as-reported accounting are removed, we can see that Carrier Global Corporation (CARR) isn’t a 6% return business. Its Uniform ROA is 25%.
Meanwhile, Microsoft Corporation (MSFT) seems like a 14% return business, but this massive technology company actually powers a 39% Uniform ROA.
That being said, to find companies that can deliver alpha beyond the market, just finding companies where as-reported metrics misrepresent a company’s real profitability is insufficient.
To really generate alpha, any investor also needs to identify where the market is significantly undervaluing the company’s potential.
These dislocations demonstrate that most of these firms are in a different financial position than GAAP may make their books appear. But there is another crucial step in the search for alpha. Investors need to also find companies that are performing better than their valuations imply.
Valens has built a systematic process called Embedded Expectations Analysis to help investors get a sense of the future performance already baked into a company’s current stock price. Take a look:
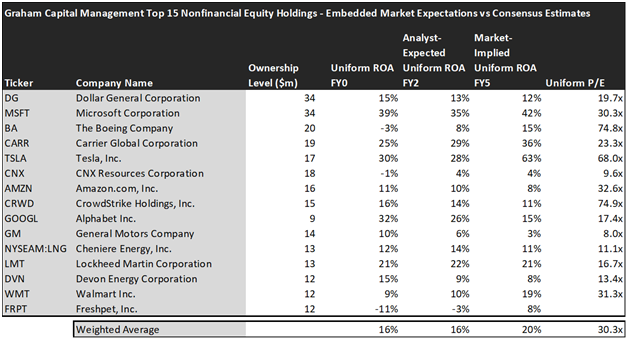
This chart shows four interesting data points:
- The average Uniform ROA among Graham Capital Management’s top 15 holdings is actually 16% which is better than the corporate average in the United States.
- The analyst-expected Uniform ROA represents what ROA is forecasted to do over the next two years. To get the ROA value, we take consensus Wall Street estimates and convert them to the Uniform Accounting framework.
- The market-implied Uniform ROA is what the market thinks Uniform ROA is going to be in the three years following the analyst expectations, which for most companies here are 2023, 2024, and 2025. Here, we show the sort of economic productivity a company needs to achieve to justify its current stock price.
- The Uniform P/E is our measure of how expensive a company is relative to its Uniform earnings. For reference, the average Uniform P/E across the investing universe is roughly 20x.
Embedded Expectations Analysis of Graham Capital Management paints a clear picture. Over the next few years, Wall Street analysts expect the companies in the fund to maintain the same levels of profitability. On the other hand, the market has a more optimistic view of the companies in the portfolio.
Analysts forecast the portfolio holdings on average to see Uniform ROA stay at the same levels of around 16% over the next two years. At current valuations, the market’s expectations are higher than analysts and it expects a 20% Uniform ROA for the companies in the portfolio.
For instance, Tesla, Inc (TSLA) returned 30% this year. Analysts think its returns will remain around the same levels at 28%. And at a 68.0x Uniform P/E, the market expects profitability to significantly improve and is pricing Uniform ROA to be around 63%.
Similarly, Walmart’s (WMT) Uniform ROA is 9%. Analysts expect its returns will stay around this level with a slight increase to 10%, but the market is much more optimistic about the company’s future and pricing its returns to be around 19%.
Overall, it appears that Graham Capital Management has included high-quality companies in its portfolio. Even looking at last year’s performance, it’s evident that the fund is highly successful in diversifying its portfolio to adjust to macro changes affecting the market.
Furthermore, with recession concerns, this fund may show promise to investors if it can position itself to capitalize on market misreads.
However, the high market expectations for the names in the portfolio may limit returns for investors as the potential improvements are already being priced in by the market. Also, the average Uniform P/E is 30.3x for the companies in the portfolio, which is significantly higher than corporate averages in the U.S.
With all that being said, investors should consider the strategy and scale of the funds they are investing in, ensuring that these different styles of investing align with their financial goals. Additionally, the current valuations are another important factor investors should consider before jumping on any investment opportunity.
This just goes to show the importance of valuation in the investing process. Finding a company with strong profitability and growth is only half of the process. The other, just as important part, is attaching reasonable valuations to the companies and understanding which have upside which has not been fully priced into their current prices.
To see a list of companies that have great performance and stability also at attractive valuations, the Valens Conviction Long Idea List is the place to look. The conviction list is powered by the Valens database, which offers access to full Uniform Accounting metrics for thousands of companies.
Click here to get access.
Read on to see a detailed tearsheet of one of Graham Capital Management’s largest holdings.
SUMMARY and Dollar General Corporation Tearsheet
As one of Graham Capital Management’s largest individual stock holdings, we’re highlighting Dollar General Corporation (DG:USA) tearsheet today.
As the Uniform Accounting tearsheet for Dollar General Corporation highlights, its Uniform P/E trades at 19.7x, which is around the global corporate average of 18.4x, but below its historical average of 21.7x.
Average P/Es require average EPS growth to sustain them. In the case of Dollar General Corporation, the company has recently shown 4% Uniform EPS growth.
Wall Street analysts provide stock and valuation recommendations that, in general, provide very poor guidance or insight. However, Wall Street analysts’ near-term earnings forecasts tend to have relevant information.
We take Wall Street forecasts for GAAP earnings and convert them to Uniform earnings forecasts. When we do this, Dollar General Corporation’s Wall Street analyst-driven forecast is for EPS to shrink by 9% in 2023 and to grow by 9% in 2024.
Furthermore, the company’s return on assets was 15% in 2022, which is 2x the long-run corporate averages. Also, cash flows and cash on hand consistently exceed its total obligations—including debt maturities and CAPEX maintenance. These signal moderate dividend risk and low credit risk.
Lastly, Dollar General Corporation’s Uniform earnings growth is in line with peer averages, and below peer valuations.
Best regards,
Joel Litman & Rob Spivey
Chief Investment Strategist &
Director of Research
at Valens Research
This portfolio analysis highlights the same insights we share with our FA Alpha Members. To find out more, visit our website.