Market volatility is a favorable factor for quantitative hedge funds as they are adept at capitalizing on price oscillations, which can be challenging for other investors. Despite outperforming the market by over 45% last year, Two Sigma may face a different type of volatility this year, which has seen substantial market fluctuations. Furthermore, the ongoing discord between the co-founders of the firm has raised concerns about Two Sigma’s future. In today’s FA Alpha Daily, we’ll look into how the abovementioned concerns might impede Two Sigma’s performance throughout 2023.
FA Alpha Daily:
Friday Portfolio Analysis
Powered by Valens Research
Even as inflation cools down and the Fed has signaled it’s slowing down its rate hikes, recession concerns are still present. Investors are sitting and waiting to see what the market does next.
Every few weeks, when a new piece of news comes out about job data, inflation, or the latest Fed actions, the market can swing dramatically. This uncertainty drives price swings as investors are concerned about what the future holds. In these situations, hedge funds often use its trading algorithms to profit from these changes. Hence, the reason quant funds often thrive in volatile markets.
We saw this last year when intraday volatility showed a similar frequency to the 2008 financial crisis. During that time, one of the largest hedge funds in the world, Two Sigma, returned 25% when the broader market fell below 20%, using those fluctuations to its advantage.
This year, the market is displaying similar conditions of volatility. However, Two Sigma doesn’t seem to be as prepared for it.
You see, Two Sigma is dealing with its own kind of volatility. Its co-founders can’t seem to agree about anything.
It’s been reported that the founders of Two Sigma, John Overdeck and David Siegel, have faced a variety of “management and governance challenges” which have resulted in disagreements on a range of topics.
The misalignment of the two founders poses an even greater challenge when considering that the operating agreement the two men drafted requires them to agree on most firm decisions.
Employees and attendees have stated that the two frequently snipe at each other in meetings, and bring their personal feuds to the office.
While management conflict is common in the finance world, it often doesn’t affect firms to the extent that it may be with Two Sigma.
If Overdeck and Siegel can’t come to an agreement, it threatens to bring the fund to a standstill. And generally, it’ll make the company a lot slower to respond to the changing market environment.
Moreover, the discord could affect the firm’s ability to retain employees as well as limit current employees’ efficiency and ability to work effectively. The combination of these factors may pose a risk to investors’ returns.
While the fund has kept the lights on so far, the future is uncertain.
In light of this situation, let’s take a look at the fund’s top holdings to see how it’s positioned today and if these internal conflicts may hurt performance moving forward.
Economic productivity is massively misunderstood on Wall Street. This is reflected by the 130+ distortions in the Generally Accepted Accounting Principles (GAAP) that make as-reported results poor representations of real economic productivity.
These distortions include the poor capitalization of R&D, the use of goodwill and intangibles to inflate a company’s asset base, a poor understanding of one-off expense line items, as well as flawed acquisition accounting.
It’s no surprise that once many of these distortions are accounted for, it becomes apparent which companies are in real robust profitability and which may not be as strong of an investment.
See for yourself below.
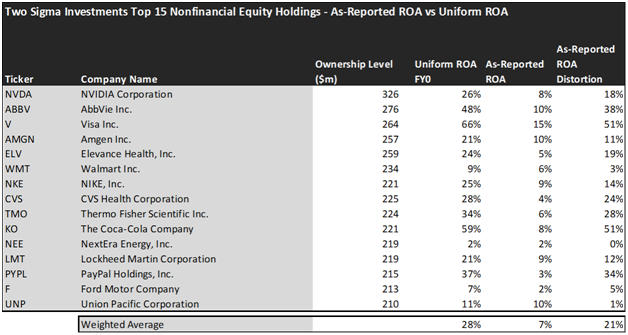
Looking at as-reported accounting numbers, investors would think that Two Sigma invests in below-average companies.
On an as-reported basis, many of the companies in the fund are significantly below-average performers. The average as-reported ROA for the top 15 holdings of the fund is 7%, which is substantially below the 12% U.S. corporate average.
However, once we make Uniform Accounting adjustments to accurately calculate the earning power, we can see that the average return in Two Sigma’s top 15 holdings is actually 28%.
As the distortions from as-reported accounting are removed, we can see that The Coca-Cola Company (KO) isn’t an 8% return business. Its Uniform ROA is 59%.
Meanwhile, AbbVie Inc. (ABBV) seems like a 10% return business, but this American pharmaceutical company actually powers a 48% Uniform ROA.
That being said, to find companies that can deliver alpha beyond the market, just finding companies where as-reported metrics misrepresent a company’s real profitability is insufficient.
To really generate alpha, any investor also needs to identify where the market is significantly undervaluing the company’s potential.
These dislocations demonstrate that most of these firms are in a different financial position than GAAP may make their books appear. But there is another crucial step in the search for alpha. Investors need to also find companies that are performing better than their valuations imply.
Valens has built a systematic process called Embedded Expectations Analysis to help investors get a sense of the future performance already baked into a company’s current stock price. Take a look:

This chart shows four interesting data points:
- The average Uniform ROA among Two Sigma’s top 15 holdings is actually 28%, which is much better than the corporate average in the United States.
- The analyst-expected Uniform ROA represents what ROA is forecasted to do over the next two years. To get the ROA value, we take consensus Wall Street estimates and convert them to the Uniform Accounting framework.
- The market-implied Uniform ROA is what the market thinks Uniform ROA is going to be in the three years following the analyst expectations, which for most companies here are 2023, 2024, and 2025. Here, we show the sort of economic productivity a company needs to achieve to justify its current stock price.
- The Uniform P/E is our measure of how expensive a company is relative to its Uniform earnings. For reference, the average Uniform P/E across the investing universe is roughly 20x.
Embedded Expectations Analysis of Two Sigma paints a clear picture. Over the next few years, Wall Street analysts expect the companies in the fund to maintain the same levels of profitability. On the other hand, the market has a more optimistic view of the companies in the portfolio.
Analysts forecast the portfolio holdings on average to see Uniform ROA slightly increase to 30% over the next two years. At current valuations, the market’s expectations are higher than analysts and it expects a 36% Uniform ROA for the companies in the portfolio.
For instance, NextEra Energy (NEE) returned 2% this year. Analysts anticipate its returns slightly increase to about 3%. However, the market has an even more optimistic viewpoint on the company’s profitability and pricing its Uniform ROA to reach 8%.
Similarly, Walmart (WMT) has a Uniform ROA of 9%. Analysts expect its returns to see a slight improvement to around 10%, but the market is much more optimistic about the company’s future and pricing its returns to be around 18%.
Through the first half of the year, Two Sigma’s main funds, AR and Spectrum, underperformed the market. They both generated under 3% returns when the S&P 500 managed to return about 16%.
It’s hard to say whether all of that underperformance is driven by its co-founders’ conflict. However, clearly it’s not replicating last year’s success.
The big question here is if management will be able to put its disagreements past them and operate in a functional manner. While there are few signs of investors pulling out of the fund, it’s necessary to monitor these situations as it may have a considerable influence over future returns.
Additionally, investors should be careful while evaluating the companies in Two Sigma’s portfolio and analyze current valuations in a detailed way as they might not be as flexible as the firm’s quant strategies.
This just goes to show the importance of valuation in the investing process. Finding a company with strong profitability and growth is only half of the process. The other, just as important part, is attaching reasonable valuations to the companies and understanding which have upside which has not been fully priced into their current prices.
To see a list of companies that have great performance and stability also at attractive valuations, the Valens Conviction Long Idea List is the place to look. The conviction list is powered by the Valens database, which offers access to full Uniform Accounting metrics for thousands of companies.
Click here to get access.
Read on to see a detailed tearsheet of one of Two Sigma’s largest holdings.
SUMMARY and NVIDIA Corporation Tearsheet
As one of Two Sigma’s largest individual stock holdings, we’re highlighting NVIDIA Corporation (NVDA:USA) tearsheet today.
As the Uniform Accounting tearsheet for NVIDIA Corporation highlights, its Uniform P/E trades at 43.7x, which is above the global corporate average of 18.4x, but around its historical average of 45.5x.
High P/Es require high EPS growth to sustain them. In the case of NVIDIA Corporation, the company has recently shown 32% Uniform EPS shrinkage.
Wall Street analysts provide stock and valuation recommendations that, in general, provide very poor guidance or insight. However, Wall Street analysts’ near-term earnings forecasts tend to have relevant information.
We take Wall Street forecasts for GAAP earnings and convert them to Uniform earnings forecasts. When we do this, NVIDIA Corporation’s Wall Street analyst-driven forecast is for EPS to grow by 167% and 42% in 2024 and 2025, respectively.
Furthermore, the company’s return on assets was 26% in 2023, which is 4x the long-run corporate averages. Also, cash flows and cash on hand consistently exceed its total obligations—including debt maturities and CAPEX maintenance. These signal low operating risk and low credit risk.
Lastly, NVIDIA Corporation’s Uniform earnings growth is above peer averages, and above peer valuations.
Best regards,
Joel Litman & Rob Spivey
Chief Investment Strategist &
Director of Research
at Valens Research
This portfolio analysis highlights the same insights we share with our FA Alpha Members. To find out more, visit our website.