The U.S. government’s climate, energy, and health care bill, which will invest an unprecedented $370 billion in clean energy and climate programs in the next decade, placed the solar industry in the limelight. Today’s FA Alpha Daily will investigate the actual profitability and performance of Invesco Solar ETF (TAN), one of the biggest names in the solar industry.
FA Alpha Daily:
Friday Uniform Portfolio Analytics
Powered by Valens Research
As the world tries to go green, the U.S. government has recently committed to this ideal. The U.S. Senate passed a climate, energy, and health care bill that will invest approximately $370 billion over the next decade in clean energy and climate programs.
The plan calls for corporate tax increases to pay for electric vehicle incentives and a plan for Medicare to be able to start negotiating the prices of drugs.
The biggest immediate winners from the bill in the market’s view weren’t electric vehicles or pharma, however. It was solar companies.
Some executives of solar companies have talked about how this bill could be the biggest legislative moment for climate and energy policy in the U.S. this decade.
The market was quick to recognize how tax breaks for these companies are likely to continue to fuel healthy growth and anticipate how this will buoy cash flows across the industry.
The spending from this bill will impact the entire solar industry in some way, from the most run-of-the-mill rooftop solar provider to big utility-scale solar infrastructure projects.
With that in mind, it wouldn’t be a surprise that people went scrambling to get exposed to Invesco Solar ETF (TAN), one of the biggest names in space.
Let’s have a look through the Uniform Accounting perspective, to see how good the companies’ investors are buying are.
Economic productivity is massively misunderstood on Wall Street. This is reflected by the 130+ distortions in the Generally Accepted Accounting Principles (GAAP) that make as-reported results poor representations of real economic productivity.
These distortions include the poor capitalization of R&D, the use of goodwill and intangibles to inflate a company’s asset base, a poor understanding of one-off expense line items, as well as flawed acquisition accounting.
It is no surprise that once many of these distortions are accounted for, it becomes apparent which companies are in real robust profitability and which may not be as strong of an investment.
See for yourself below.
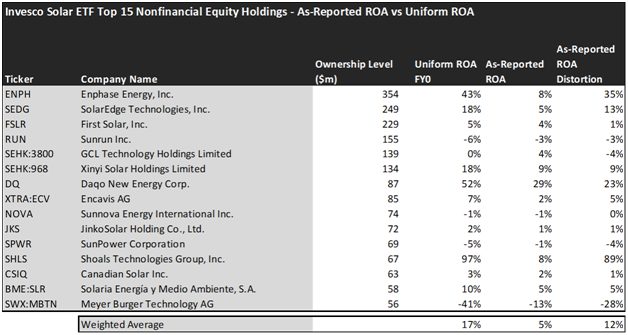
Using as-reported accounting, investors would think investing in the solar industry is not really profitable.
On an as-reported basis, many of these companies are poor performers in terms of profitability and operating with an average as-reported ROA of just 5% which is below the corporate averages in the United States.
However, once we make Uniform Accounting (UAFRS) adjustments to accurately calculate earning power, we can see that the returns of the companies that make up Invesco Solar ETF are much more robust.
The average company in the portfolio displays an impressive average Uniform ROA of 17%, which is almost double corporate average returns.
Once the distortions from as-reported accounting are removed, we can realize that Daqo New Energy Corporation (DQ) doesn’t have a ROA of 29%, but returns of 52%.
Similarly, Enphase Energy’s (ENPH) ROA is actually 43%, not 8%. Enphase Energy was established in 2006 and the company develops, manufactures, and sells all of the peripheral solar products like inverters and battery managers for residential customers.
Shoals Technologies Group (SHLS) is another great example of as-reported metrics misrepresenting the company’s profitability. With a Uniform ROA of 97%, an as-reported of 8% is wholly misleading and misses the story.
To find companies that can deliver alpha beyond the market, just finding companies where as-reported metrics misrepresent a company’s real profitability is insufficient.
To really generate alpha, any investor also needs to identify where the market is significantly undervaluing the company’s potential.
Once we account for Uniform Accounting adjustments, we can see that many of these companies are strong stocks but have already realized most of their potential.
These dislocations demonstrate that most of these firms are in a different financial position than GAAP may make their books appear. But there is another crucial step in the search for alpha. Investors need to also find companies that are performing better than their valuations imply.
Valens has built a systematic process called Embedded Expectations Analysis to help investors get a sense of the future performance already baked into a company’s current stock price. Take a look:
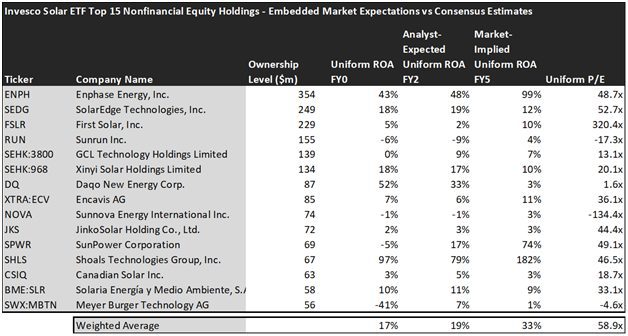
This chart shows four interesting data points:
- The Uniform ROA FY0 represents the company’s current return on assets, which is a crucial benchmark for contextualizing expectations.
- The analyst-expected Uniform ROA represents what ROA is forecasted to do over the next two years. To get the ROA value, we take consensus Wall Street estimates and convert them to the Uniform Accounting framework.
- The market-implied Uniform ROA is what the market thinks Uniform ROA is going to be in the three years following the analyst expectations, which for most companies here are 2022, 2023, and 2024. Here, we show the sort of economic productivity a company needs to achieve to justify its current stock price.
- The Uniform P/E is our measure of how expensive a company is relative to its Uniform earnings. For reference, the average Uniform P/E across the investing universe is roughly 24x.
Embedded Expectations Analysis of Invesco Solar ETF paints a clear picture of the fund. While the stocks it tracks are strong performers historically, the markets are pricing them to increase their profitability, while analysts are not that optimistic.
While analysts forecast the fund to see Uniform ROA slightly improve to 19% over the next two years, the market is pricing the fund to see returns climb to 33% levels, which may lead to some downside risk.
In particular, there are a couple of companies that may lead investors to be cautious.
The markets are expecting SunPower Corporation’s Uniform ROA to rise to 74%. Meanwhile, analysts are projecting the company’s returns to increase from -5% to 17%.
Sunrun’s stock is priced to see the company’s Uniform ROA reach 4%, but analysts think returns will stay negative at -9%.
Overall, the portfolio is composed of companies that can benefit from the new clean energy bill and have high-growth and high-profitability potential.
However, it looks like the market may have been a bit too exuberant about investing in solar companies after the bill has passed, and a correction back to lower valuation levels may be in the industry’s future.
This just goes to show the importance of valuation in the investing process. Finding a company with strong growth is only half of the process. The other, just as important part is attaching reasonable valuations to the companies and understanding which have upside which has not been fully priced into their current prices.
To see a list of companies that have great performance and stability also at attractive valuations, the Valens Conviction Long Idea List is the place to look. The conviction list is powered by the Valens database, which offers access to full Uniform Accounting metrics for thousands of companies.
Click here to get access.
Read on to see a detailed tearsheet of Invesco Solar ETF’s largest holding.
SUMMARY and Enphase Energy, Inc. Tearsheet
As one of TAN’s largest individual stock holdings, we’re highlighting Enphase Energy, Inc. (ENPH:USA) tearsheet today.
As the Uniform Accounting tearsheet for Enphase Energy highlights, its Uniform P/E trades at 48.7x, which is above the global corporate average of 19.3x but below historical average of 53.6x.
Low P/Es require low EPS growth to sustain them. That said, in the case of Enphase Energy, the company has recently shown 9% Uniform EPS growth.
Wall Street analysts provide stock and valuation recommendations that, in general, provide very poor guidance or insight. However, Wall Street analysts’ near-term earnings forecasts tend to have relevant information.
We take Wall Street forecasts for GAAP earnings and convert them to Uniform earnings forecasts. When we do this, Enphase Energy’s Wall Street analyst-driven forecast is for EPS to grow by 104% in 2021 and by 56% in 2022.
Furthermore, the company’s return on assets was 12% in 2020, which is above the long-run corporate averages. Also, cash flows and cash on hand are 8x its total obligations—including debt maturities and CAPEX maintenance. Moreover, its intrinsic credit risk is 80bps above the risk-free rate. Together, these signal low credit risks.
Lastly, Enphase Energy’s Uniform earnings growth is well-above peer averages and is trading well-above peer valuations.
Best regards,
Joel Litman & Rob Spivey
Chief Investment Strategist &
Director of Research
at Valens Research
This portfolio analysis highlights the same insights we share with our FA Alpha Members. To find out more, visit our website.