When investing against other portfolio managers in the market, the first step is gauging how they are positioned. On today’s FA Alpha, we will be talking about sentiment among investors.
FA Alpha Daily:
Monday Macro
Powered by Valens Research
If it seems like the market is a lot more volatile this year, it’s because it is.
Last year, there were 20 days when the S&P 500 was down more than 1%. That means the S&P dropped 1% or more roughly one in every 12 to 13 trading days.
So far, 37 trading days in 2022, there have been 12 days with the market down 1%, which translates to roughly one in three days.
That is a lot of big swings… and it has spooked investors. This fear has led to technical analysts focusing on corrections and death crosses, scary names for short, sharp plummets.
As we discussed Friday, it’s easy to get caught up in the headlines and short-term market moves and miss how the market is set up for longer-term success.
When everyone is spooked, it can mean opportunities.
If you want to react to macro signals, you need to do it thoughtfully and systematically. Rather than simply reacting when the market does, listening to the data keeps you one step ahead.
For example, a popular bearish indicator for technicians is the death cross, as we mentioned above. Despite the ominous name, this just means the 50-day moving average of a stock price has crossed below the 200-day moving average, a signal that stock price is accelerating downwards.
One might assume that technicians talk about it because it has a proven history of predicting further market drops. That isn’t the case, though. Over the last 25 death crosses for the Nasdaq, the index doubled its average performance two weeks later.
The market may tend to rise after this signal because it may be showing something quite different from what technicians think it does. It may be a great signal of capitulation. When stocks drop quickly, causing the 50 DMA to fall less than the 200, it might be a sign everyone is bailing out.
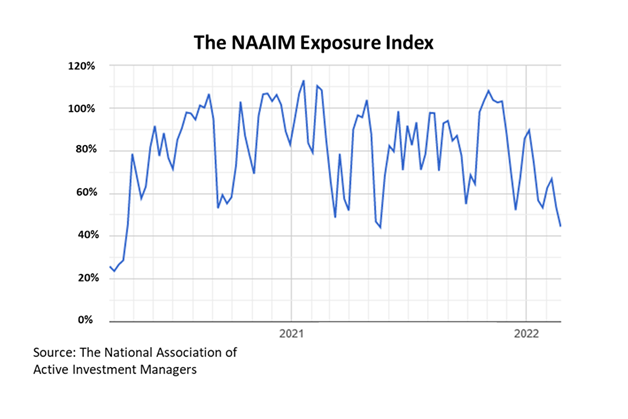
We can use the National Association of Active Investment Managers (“NAAIM”) Exposure Index to spot capitulation.
This tracks when investors are all in on the market, meaning they own a greater share of equities, compared with when equity investors are panicked and have sold their positions.
When everyone else has sold their equity due to the conflict in Ukraine, the pandemic, inflation, or any other event, smart investors know that it is a great time to be contrarian and buy.
If selling has been exhausted, and there’s no real fundamental catalyst for the market to go lower, the market may be well-positioned to bounce back.
Right now, it appears to be one of those times. According to the NAAIM Exposure Index, equity investor exposure has been at the low end of exposure levels since the pandemic.
The percentage of the average active equity investor’s portfolio that is long in the stock market is around 44%.
The last time investors were this pessimistic was May 2021, right before the stock market roared back to life, returning almost 16% by the end of the year.

Sitting at these low levels, it looks like anyone who would be scared out of the markets most likely has already sold. If there is no one left to sell after a mass capitulation, there is only one way for the market to go as people buy back in.
A great example of this is the market’s strong bounce back last week after the news of Russia’s invasion of Ukraine. Since everyone was already out of the market, there were no remaining sellers…
So, while the headlines may be scary, smart investors say if it’s in the headlines, it’s already in the markets. This means it’s time to be buying at a discount.
Best regards,
Joel Litman & Rob Spivey
Chief Investment Strategist &
Director of Research
at Valens Research
To see our best macro insights, get access to FA Alpha Pulse.
