Elon Musk, the wealthiest person on Earth by a margin of nearly $30 billion, was named Time Magazine’s person of the year for 2021.
As Time highlights, Musk has made a bigger impact on how we’re thinking about the future of life on and off Earth than anyone.
His superstar-like status is largely a byproduct of Tesla’s (TSLA) successes in kickstarting the electric vehicle (EV) revolution and becoming the first American automaker to independently reach mass production in almost 100 years.
That’s right-—the last American car company to reach sustainable mass production other than Tesla was Chrystler, founded in 1925. All others that tried were either swallowed by or fen out of business by the big three American car companies. Tesla was the first to break through on its own.
Tesla has been flirting with a $1 trillion market cap, floating on both sides of the barrier, since late October. That’s a truly awe-inspiring valuation for an automaker, given that the next largest is Toyota, at only $250 billion.
However, just as Tesla’s valuation is four times that of the runner-up, so too is its share of U.S. EV sales. Take a look:

Furthermore, Tesla holds a structural advantage: All of its capital investment is optimized for EV production from the get-go.
Meanwhile, competitors like Ford and GM are burdened with billions of dollars of capital equipment meant to produce internal combustion engine (ICE) cars. As consumers and governments accelerate the shift to an all-electric future, that equipment will need to be repurposed or replaced to one day build EVs, to the behest of original financiers and stakeholders.
So long as they operate with a foot in each camp, the traditional automakers will always prefer to sell ICE cars, even if it means swimming against the current. After all, they’ve been building the equipment and know-how for decades, and throwing it all away to suddenly sell EVs may be hard to swallow.
Many automotive analysts even agree that for the past decade, the electric cars sold by traditional automakers were never meant to appeal to the masses in and of themselves. Their true purpose was to promote an environmentally-conscious brand image that can help them sell more ICE cars.
This strategy was responsible for cars like the Nissan Leaf, BMW i3, and Chevy Bolt, generally considered to be rather odd-looking and impractical compared to the other ICE cars in the lineup.
Tesla went all-in on EVs from day one, with no conflicts of interest, and a desire to reorganize the industry in a way beneficial to itself. Now that dozens of countries and multiple U.S. states have announced upcoming bans on ICE sales in the 2030s, and non-Tesla automakers scramble to put together compelling EVs, it is clear that Tesla succeeded.
But Tesla is not the only way to invest in the EV revolution. At its current sky-high valuation, investors would be right to look for other ways to join in.
The GlobalX ETF DRIV gives investors an opportunity to invest in a whole slew of companies that stand to benefit from an all-electric world. The fund also focuses on another technology that has risen alongside EVs, autonomous driving (AV).
Let’s take a look inside, as some of the names that DRIV holds may surprise you. While the fund holds several direct automakers that are investing in EV lineups, it is weighted more towards technology providers and suppliers.
For example, DRIV holds nearly as much Tesla stock as it does Nvidia (NVDA). That is because Nvidia has invested heavily into optimizing its GPU technology for AV processing and automotive computing. Similarly, the fund holds Apple (AAPL) in anticipation of the long-awaited electric Apple Car, and Alphabet (GOOGL) for its ownership of the cutting-edge AV company Waymo.
The fund also holds several semiconductor and microprocessor companies that are becoming ever more important to the automotive industry as cars become rolling computers. It also holds several mining companies that are delivering the raw materials needed for battery production.
Of the major automakers, the fund is heavily invested in Toyota (TSE:7203), which has just unveiled nearly 30 new EV models to be launched by 2030, and Ford (F), which has emerged as a leader with highly popular models like the Mustang Mach E and the F-150 Lightning.
Now let’s take a look at the fund using Uniform Accounting to see if it looks compelling on a fundamentals basis.
Here at Valens, return on assets (“ROA”) is our favorite measure of corporate performance because it quantifies scaled economic productivity. Due to the distortions inherent to the Generally Accepted Accounting Principles (or GAAP), which is the rulebook by which American companies report their finances, the numbers perceived by the public are actually a far cry from reality.
Our Uniform Accounting framework corrects the deficiencies of GAAP. We make over 130 adjustments to the financial statements of every company to isolate real performance from the noise.
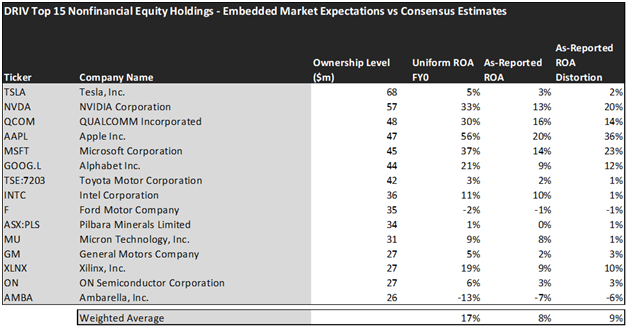
To the untrained eye, it may appear that DRIV only has 8% aggregate ROA, well below the corporate average. But after applying Uniform principles, these companies emerge to be far more profitable, with an average Uniform ROA of 17%.
Take a look at Microsoft (MSFT), which has been partnering with AV companies like Cruise to provide them with cheaper access to its cloud services. On an as-reported basis, the firm generates 14% ROAs, but in reality, is more than twice as profitable with 37% Uniform ROAs.
Similarly, take a look at Xilinx (XLNX), a technology company that makes essential components for cars’ onboard computing systems. While the firm appears to only have 9% Uniform ROAs, Uniform Accounting shows that its true ROA is 19%.
Investors need to remember… Finding companies that perform well is an important first step in investing, but it does not hold the key to finding alpha.
Investors need to find those companies that perform well, but are priced to perform poorly. Without the visibility of Uniform Accounting, this may be difficult to quantify. Thanks to our team’s Embedded Expectations Analysis, we can see exactly what a company is priced to do.
The chart below compares analyst-expected returns with market-expected returns. When there is a severe dislocation between the two, it can often mean the market is failing to understand something about a company. See for yourself:
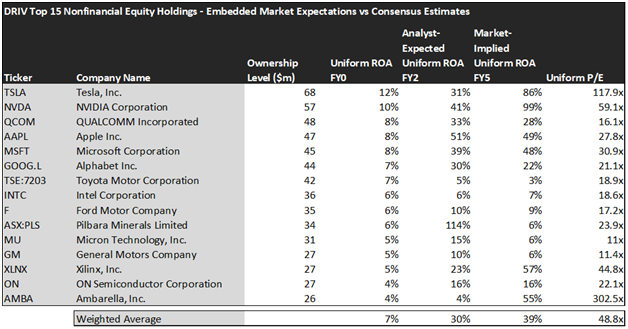
This chart shows four interesting data points:
- The Uniform ROA FY0 represents the company’s current return on assets, which is a crucial benchmark for contextualizing expectations.
- The Analyst-Expected Uniform ROA represents what ROA is forecast to be over the next two years. To get the ROA number, we take consensus Wall Street estimates and we convert them to the Uniform Accounting framework.
- The market-implied Uniform ROA is what the market thinks Uniform ROA is going to be in the three years following the analyst expectations, which for most companies here is 2023, 2024, and 2025. Here, we show the sort of economic productivity a company needs to achieve to justify its current stock price.
- The Uniform P/E is our measure of how expensive a company is relative to its Uniform earnings. For reference, average Uniform P/E across the investing universe is roughly 24x.
While analysts expect these companies to reach Uniform ROAs of 30% in the next two years, the market has loftier expectations for 39% Uniform ROA by 2025.
Generally, this points to a potentially overvalued portfolio. If investors have baked in certain expectations for profitability and performance, and the companies held by the fund aren’t able to deliver, there may be significant downside risk.
For example, take a look at a classic example, Tesla. Despite the great work that Elon Musk and the Tesla team have put into growing the firm, it is unlikely to ever achieve the profitability levels embedded by its $1 trillion valuation.
Analysts expect Tesla to reach a 31% ROA by 2022, which is significantly higher than any other automaker and speaks to its great products and talented management team. The market, however, is expecting the firm to reach 86% ROA. That is a level of productivity only ever achieved by the best asset-light software companies, not asset-intensive car manufacturers.
While Tesla has repeatedly beat short sellers into submission with its unprecedented market dynamics, it is now harder than ever to make a value-based bull case for the stock.
Overall, DRIV is an expensive portfolio, with an average Uniform P/E of 48.8x. While that may turn value-driven investors away, it is important to acknowledge that innovative companies can stay expensive for a long time.
Investors need to soberly evaluate their intended balance for risk and reward, and prepare themselves for volatility when investing in expensive growth names such as these.
If you want to dig deeper into the financial realities of companies like Tesla, consider subscribing to the Valens Research Database. The database offers access to full Uniform Accounting metrics for thousands of companies, so you can evaluate your investments using real, undistorted data.
Click here to get access.
Read on to see a detailed tearsheet of the largest holding in DRIV.
SUMMARY and Tesla, Inc. Tearsheet
As DRIV’s largest individual stock holdings, we’re highlighting Tesla, Inc.’s tearsheet today.
As the Uniform Accounting tearsheet for Tesla, Inc. (TSLA:USA) highlights, its Uniform P/E trades at 148.6x, which is above the global corporate average of 24.0x and its own historical average of 106.9x.
High P/Es require high EPS growth to sustain them. In the case of TSLA, the company has recently shown a 27% Uniform EPS shrinkage.
Wall Street analysts provide stock and valuation recommendations that, in general, provide very poor guidance or insight. However, Wall Street analysts’ near-term earnings forecasts tend to have relevant information.
We take Wall Street forecasts for GAAP earnings and convert them to Uniform earnings forecasts. When we do this, TSLA’s Wall Street analyst-driven forecast is for EPS to significantly grow by 1,342% in 2021 and 77% in 2022.
Based on the current stock market valuations, we can use earnings growth valuation metrics to back into the required growth rate to justify Tesla’s $927 stock price. These are often referred to as market embedded expectations.
The company is currently being valued as if Uniform earnings were to grow 118% annually over the next three years. What Wall Street analysts expect for Tesla’s earnings growth is above what the current stock market valuation requires in 2021, but below that requirement in 2022.
Meanwhile, the company’s earning power is around the long-run corporate averages. However, cash flows and cash on hand are around 4x total obligations—including debt maturities, capex maintenance, and dividends. Furthermore, intrinsic credit risk is just 20bps. Together, these signal low dividend and credit risks.
Lastly, TSLA’s Uniform earnings growth is above peer averages, and the company is trading above its average peer valuations.
Best regards,
Joel Litman & Rob Spivey
Chief Investment Strategist &
Director of Research
at Valens Research
This portfolio analysis highlights the same insights we use to power our FA Alpha product. To find out more visit our website.