Founded in 1977, Elliott Management was led by Paul Singer, who focused on distressed assets from the beginning of the fund. He would buy bankrupt firms and near-default countries’ debt and push them to pay the obligation through the courts.
His background in law surely helps him to take such risks.
Paul Singer describes this business model as “a fight against charlatans who refuse to play by the market’s rules”.
In case of a default, he is taking over the companies, turning them around to become profitable, and selling them for a large sum.
A great example of his business model has come out recently with the sale of AC Milan.
In 2018, Elliott loaned 415 million euros to Li Yonghong for the purchase of the famous club. However, when Li defaulted on his debt, the fund took over the club and invested 50 million euros to stabilize the finances and fund the club’s transformation.
When Elliott Management took over the club, AC Milan was in a financial struggle and finished the league in 6th position.
Since 2018, the club showed great improvement and became the champion of Italy’s professional football league “Serie A” in 2022 and earned a qualification to attend the Champions League next season.
With this successful transformation, Elliott managed to sell AC Milan to Redbird Capital for a whopping 1.2 billion euros in the beginning of June.
A great investor and a master of the takeover, Paul Singer definitely has the knowledge and courage to transform companies and earn himself a significant profit.
With that in mind, one expects Paul Singer and his fund to make extraordinary returns.
That is why we’re going to take a closer look at Elliott Management using Uniform Accounting, to see if the fund performs in line with the expectations of a great investor like Paul Singer.
Economic productivity is massively misunderstood on Wall Street. This is reflected by the 130+ distortions in the Generally Accepted Accounting Principles (GAAP) that make as-reported results poor representations of real economic productivity.
These distortions include the poor capitalization of R&D, the use of goodwill and intangibles to inflate a company’s asset base, a poor understanding of one-off expense line items, as well as flawed acquisition accounting.
It is no surprise that once many of these distortions are accounted for, it becomes apparent which companies are in real robust profitability and which may not be as strong of an investment.
Just as one would expect, there is still merit to investing in companies that combine the power of finance and technology, as the Uniform returns are much stronger than the as-reported metrics dictate.
See for yourself below.
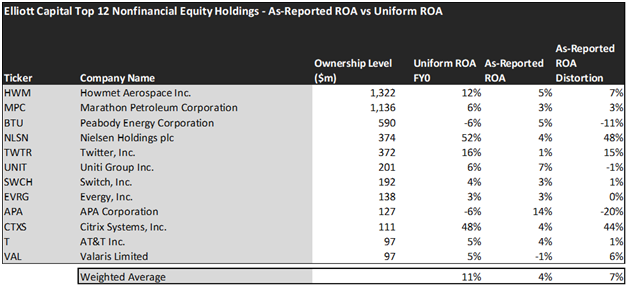
Using as-reported accounting, investors would think investing in Elliott’s portfolio achieves a very weak return on assets (ROA).
On an as-reported basis, many of these companies are poor performers that destroy value by operating with an average as-reported ROA of around 4%.
However, once we make Uniform Accounting (UAFRS) adjustments to accurately calculate earning power, we can see that the returns of the companies in the Elliott Management are much more robust.
The average company in the portfolio displays an impressive average Uniform ROA of 11%. This is slightly higher than corporate average returns.
Once the distortions from as-reported accounting are removed, we can realize that Howmet Aerospace (HWM) doesn’t have an ROA of 5%, but returns of 12%.
Similarly, Citrix Systems’ (CTXS) ROA is really 48%, not 4% as GAAP would have you believe. By supporting invaluable cloud technology, Citrix is able to earn a premium return.
Nielsen (NLSN), is another great example of as-reported metrics mis-representing the company’s profitability. With a Uniform ROA of 52%, an as-reported of 4% is wholly misleading and misses the story.
If Paul Singer would invest in these companies as powered by as-reported metrics, investors would not give their money to Elliott Management with such low profitability.
To find companies that can deliver alpha beyond the market, just finding companies where as-reported metrics mis-represent a company’s real profitability is insufficient.
To really generate alpha, any investor also needs to identify where the market is significantly undervaluing the company’s potential.
Elliott Management has the expertise and its successful history to make extraordinary investments that can deliver high returns.
Once we account for Uniform Accounting adjustments, we can see that many of these companies are strong stocks but have already realized most of their potential.
These dislocations demonstrate that most of these firms are in a different financial position than GAAP may make their books appear. But there is another crucial step in the search for alpha. Investors need to also find companies that are performing better than their valuations imply.
Valens has built a systematic process called Embedded Expectations Analysis to help investors get a sense of the future performance already baked into a company’s current stock price. Take a look:
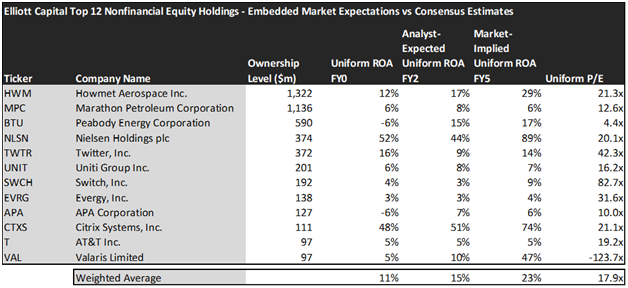
This chart shows four interesting data points:
- The Uniform ROA FY0 represents the company’s current return on assets, which is a crucial benchmark for contextualizing expectations.
- The analyst-expected Uniform ROA represents what ROA is forecasted to do over the next two years. To get the ROA value, we take consensus Wall Street estimates and convert them to the Uniform Accounting framework.
- The market-implied Uniform ROA is what the market thinks Uniform ROA is going to be in the three years following the analyst expectations, which for most companies here is 2023, 2024, and 2025. Here, we show the sort of economic productivity a company needs to achieve to justify its current stock price.
- The Uniform P/E is our measure of how expensive a company is relative to its Uniform earnings. For reference, the average Uniform P/E across the investing universe is roughly 24x.
Embedded Expectations Analysis of Elliott Management paints a clear picture of the fund. While the stocks it tracks are strong performers historically, the markets are pricing them to slightly decline in profitability, while analysts are expecting a steeper decline.
While analysts forecast the fund to see Uniform ROA rise to 15% over the next two years, the market is pricing the fund to see returns further improve to 23% levels, which may lead to some downside risk.
In particular, there are a couple of companies that may lead investors to be cautious.
The markets are expecting Howmet Aerospace’s Uniform ROA to rise to 29%. Meanwhile, analysts are projecting the company’s returns to only slightly increase to 17%. The market may be disappointed when the company is unable to reach such highs.
Switch (SWCH) may further disappoint investors as their returns are expected to only further decrease to 3% Uniform ROA, while the market expects them to increase their returns to 9%.
This just goes to show the importance of valuation in the investing process. Finding a company with strong growth is only half of the process. The other, just as important part, is attaching reasonable valuations to the companies and understanding which have upside which have not been fully priced into their current prices.
To see a list of companies that have great performance and stability also at attractive valuations, the Valens Conviction Long Idea List is the place to look. The conviction list is powered by the Valens database, which offers access to full Uniform Accounting metrics for thousands of companies.
Click here to get access.
Read on to see a detailed tearsheet of Elliott Capital’s largest holdings.
SUMMARY and Howmet Aerospace Inc. Tearsheet
As Elliot Capital’s largest individual stock holding, we’re highlighting Howmet Aerospace Inc. (HWM:USA) tearsheet today.
As the Uniform Accounting tearsheet for Howmet highlights, its Uniform P/E trades at 21.3x, which is around the global corporate average of 20.6x, but below its historical average of 23.8x.
Moderate P/Es require moderate EPS growth to sustain them. In the case of Howmet, the company has recently shown a 16% Uniform EPS shrinkage.
Wall Street analysts provide stock and valuation recommendations that, in general, provide very poor guidance or insight. However, Wall Street analysts’ near-term earnings forecasts tend to have relevant information.
We take Wall Street forecasts for GAAP earnings and convert them to Uniform earnings forecasts. When we do this, Howmet’s Wall Street analyst-driven forecast is for EPS to grow by 42% and 33% in 2022 and 2023, respectively.
Based on the current stock market valuations, we can use earnings growth valuation metrics to back into the required growth rate to justify Howmet’s $34 stock price. These are often referred to as market embedded expectations.
The company is currently being valued as if Uniform earnings were to grow by 5% annually over the next three years. What Wall Street analysts expect for Howmet’s earnings growth is above what the current stock market valuation requires through 2023.
Meanwhile, the company’s earning power is 2x the long-run corporate averages. Also, cash flows and cash on hand are nearly 2x the total obligations—including debt maturities and capex maintenance. However, intrinsic credit risk is 150bps. All in all, these signal a low dividend risk and a moderate credit risk.
Lastly, Howmet’s Uniform earnings growth is above peer averages, but is trading below its average peer valuations.
Best regards,
Joel Litman & Rob Spivey
Chief Investment Strategist &
Director of Research
at Valens Research
This portfolio analysis highlights the same insights we use to power our FA Alpha product. To find out more visit our website.