Small fintech startups in recent years have transformed the way we think about investing and trading.
Instead of making investing an intimidating endeavor, companies like Robinhood (HOOD), have gamified the process to make it a fun and welcoming experience.
While the new generation of financial companies have been able to rapidly gain steam in the process, some of the companies that first revolutionized the space aren’t to be discounted.
One of the companies that have been at the forefront of the transition towards making investing more consumer-centric for decades has been Fidelity Investments.
However, Fidelity’s emergence as a financial powerhouse was not at all guaranteed – it was powered by Ned Johnson, who passed away last month.
After beginning as a singular investment fund in 1930, the company expanded throughout the rest of the 20th century as the investment world changed.
As a recent New York Times piece highlighted, Johnson was a pioneer of democratizing access to investing.
From the 1970s through the 2000s, he made investing more accessible first by giving people access to better yielding assets through money market accounts. Then, when yields fell, Fidelity Investments introduced the general public to stock investing with mutual funds, most notably Peter Lynch’s Magellan fund.
Fidelity was at the forefront of helping people invest during the dotcom era, and has been a prominent choice for folks to manage their 401ks.
Johnson truly empowered the average investors to give them a lot more control, proving their ability beyond what many on Wall Street gave them credit for, while transforming wealth creation as a result.
The bedrock of what powered Fidelity to prominence was Peter Lynch’s track record at the Magellan fund, which allowed him to make investing look easy for the average person at home.
By demystifying the process and producing a 29% a year return from 1977 to 1990 when he was running the fund, Peter Lynch staked his name as one of the greatest investors of all time while helping Fidelity establish its dominance in the space.
Since then, Magellan has had its ups and downs, and it still remains a flagship fund for Fidelity. Today, let’s use Uniform Accounting to see if it’s still helping steer people through the challenging waters of investing.
Economic productivity is massively misunderstood on Wall Street. This is reflected by the 130+ distortions in the Generally Accepted Accounting Principles (GAAP) that make as-reported results poor representations of real economic productivity.
These distortions include the poor capitalization of R&D, the use of goodwill and intangibles to inflate a company’s asset base, a poor understanding of one-off expense line items, as well as flawed acquisition accounting.
It is no surprise that once many of these distortions are accounted for, it becomes apparent which companies are in reality robustly profitable and which may not be as strong of an investment.
Just as one would expect from such a legendary investor, the Fidelity Magellan portfolio is much stronger than the as-reported metrics dictate.
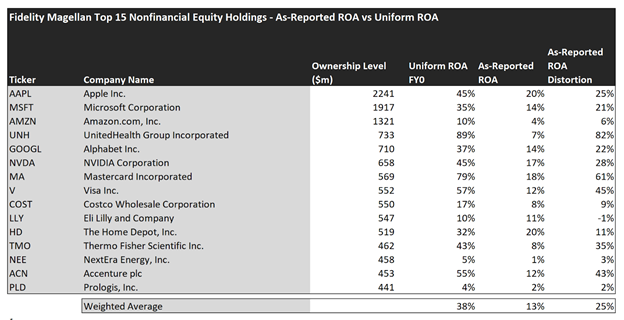
The average as-reported ROA among Magellan’s top 15 names is 13%, right around U.S. corporate averages. In reality, though, these companies are massively profitable on average, with a 38% Uniform ROA across the top 15.
UnitedHealth Group (UNH) for example doesn’t have below average 7% returns. Rather, as a company with massive tailwinds in the healthcare sector, it has an 89% Uniform ROA.
Similarly, Thermo Fisher Scientific (TMO), doesn’t return a barely above cost-of-capital return of 8%. Instead, with demand for healthcare-related tools and products skyrocketing, it has produced a 43% Uniform ROA.
Some of Magellan’s other investments are also much stronger than they appear. For example, Accenture (ACN) isn’t an average business. It has 55% returns because it has an asset-light model that relies primarily on human capital.
Largely, once we account for Uniform Accounting adjustments, we can see that many of these companies are strong stocks that have unfairly been beaten down by occluded accounting standards.
These dislocations demonstrate that most of these firms are in a different financial position than GAAP may make their books appear. But there is another crucial step in the search for alpha. Investors need to also find companies that are performing better than their valuations imply.
Valens has built a systematic process called Embedded Expectations Analysis to help investors get a sense of the future performance already baked into a company’s current stock price. Take a look:
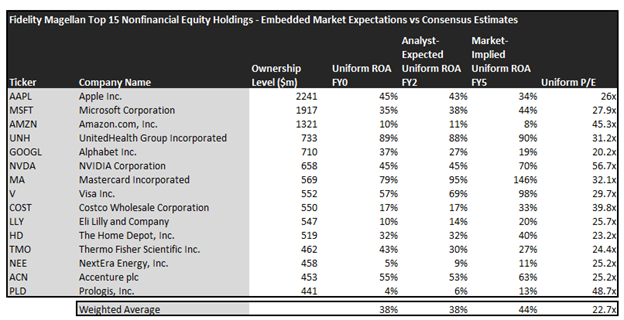
- The Uniform ROA FY0 represents the company’s current return on assets, which is a crucial benchmark for contextualizing expectations.
- The analyst-expected Uniform ROA represents what ROA is forecasted to do over the next two years. To get the ROA value, we take consensus Wall Street estimates and we convert them to the Uniform Accounting framework.
- The market-implied Uniform ROA is what the market thinks Uniform ROA is going to be in the three years following the analyst expectations, which for most companies here is 2023, 2024, and 2025. Here, we show the sort of economic productivity a company needs to achieve to justify its current stock price.
- The Uniform P/E is our measure of how expensive a company is relative to its Uniform earnings. For reference, average Uniform P/E across the investing universe is roughly 24x.
Embedded Expectations Analysis of Magellan paints a clear picture of the fund. The stocks it tracks are strong, but the markets are already pricing them in for similar levels of profitability, if not slightly higher levels of returns.
While the fund has analysts expecting them to maintain Uniform ROA at 38%, the market is pricing the fund in for slightly higher returns at 44%. While earnings can always compound beyond analyst expectations, it looks like in aggregate Magellan is overpaying for its current investments.
Although much of the portfolio is accurately priced, there are still some significant distortions that could lead to some disappointment.
While Nvidia (NVDA) has surged in size and profitability in recent years, it may have reached a point where it can’t sustain its pace. While the market is pricing them in for 70% returns, analysts are expecting them to just maintain their 45% profitability.
Costco (COST) may similarly disappoint as the market is projecting them to reach new highs of 33% Uniform ROA, while analysts only expect them to maintain their current 17% returns.
This just goes to show the importance of valuation in the investing process. Finding a company with strong growth is only half of the process. The other, just as important part, is attaching reasonable valuations to the companies and understanding which have upside which have not been fully priced into their current prices.
To see a list of companies that have great performance and stability also at attractive valuations, the Valens Conviction Long Idea List is the place to look. The conviction list is powered by the Valens database, which offers access to full Uniform Accounting metrics for thousands of companies.
Click here to get access.
Read on to see a detailed tearsheet of the largest holding in the Fidelity Magellan Fund.
SUMMARY and Apple Inc. Tearsheet
As Fidelity Magellan’s largest individual stock holding, we’re highlighting Apple Inc.’s (AAPL:USA) tearsheet today.
As the Uniform Accounting tearsheet for Apple highlights, its Uniform P/E trades at 26.0x, which is around the global corporate average of 24.0x, but above its historical average of 20.4x.
Moderate P/Es require moderate EPS growth to sustain them. In the case of Apple, the company has recently shown a Uniform EPS growth of 72%.
Wall Street analysts provide stock and valuation recommendations that, in general, provide very poor guidance or insight. However, Wall Street analysts’ near-term earnings forecasts tend to have relevant information.
We take Wall Street forecasts for GAAP earnings and convert them to Uniform earnings forecasts. When we do this, Apple’s Wall Street analyst-driven forecast is for EPS to grow by 7% and 3% in 2022 and 2023, respectively.
Based on the current stock market valuations, we can use earnings growth valuation metrics to back into the required growth rate to justify Apple’s $165.29 stock price. These are often referred to as market embedded expectations.
The company is currently being valued as if Uniform earnings were to grow by 8% annually over the next three years. What Wall Street analysts expect for Apple’s earnings growth is below what the current stock market valuation requires through 2023.
Meanwhile, the company’s earning power is well above long-run corporate averages. Also, cash flows and cash on hand consistently exceed total obligations—including debt maturities and capex maintenance. Moreover, intrinsic credit risk is 10 bps. Together, these signal low dividend and credit risks.
Lastly, Apple’s Uniform earnings growth is below its peer averages, but is trading well above its average peer valuations.
Best regards,
Joel Litman & Rob Spivey
Chief Investment Strategist &
Director of Research
at Valens Research
This portfolio analysis highlights the same insights we use to power our FA Alpha product. To find out more visit our website.