Often dismissing his stellar track record, Bill Miller is one of the most successful long-only investors of the past 30 years. He was able to beat the S&P 500 for 15 years straight. In today’s FA Alpha, let’s check Miller Opportunity Trust by Bill Miller where Embedded Expectations Analysis is also applied.
FA Alpha Daily:
Friday Portfolio Analysis
Powered by Valens Research
There are lots of successful investors all around the world, but few of them come to mind in terms of long-only strategies.
Managing a long-only fund could be difficult due to various restrictions. Also, your performance could be highly dependent on how the market behaves over a certain period of time as you are only allowed to take positions in one direction.
For instance, in bear markets, you would not be able to short-sell to capture high returns, or in a bull market, you cannot take highly leveraged positions to maximize your profits.
However, there is a great long-only investor who overcome all these difficulties and beat the S&P 500 for 15 years straight, Bill Miller.
Along with being one of the most successful long-only investors of the past 30 years, he’s a very humble person as well.
He often dismissed his stellar track record, saying that it was a fluke of the calendar, as there were many 12-month periods he didn’t beat the market.
But the reality is that the calendar is real, and he didn’t get lucky because of it. He’s just been a great investor and he understands how to pick stocks.
In fact, when we teach stock picking to our new analysts, we use many of his quotes, because he talks about the same things we do, like our Embedded Expectations Analysis.
He strictly mentions that value investing is not just finding cheap companies with low Price-to-Earnings (P/E) or avoiding expensive ones with high P/Es. For him, value investing is all about finding the best value by catching mispriced opportunities in the market.
This is exactly what we are aiming for here at Valens Research, to find opportunities that the market has not priced in yet.
Right now, let’s see if his stocks live up to an investor who cares about finding low-embedded expectations from the market, and one who can beat the market consistently.
Economic productivity is massively misunderstood on Wall Street. This is reflected by the 130+ distortions in the Generally Accepted Accounting Principles (GAAP) that make as-reported results poor representations of real economic productivity.
These distortions include the poor capitalization of R&D, the use of goodwill and intangibles to inflate a company’s asset base, a poor understanding of one-off expense line items, as well as flawed acquisition accounting.
It’s no surprise that once many of these distortions are accounted for, it becomes apparent which companies are in real robust profitability and which may not be as strong of an investment.
See for yourself below.
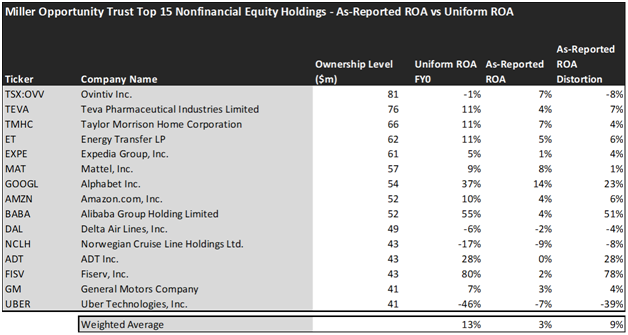
Looking at as-reported accounting numbers, investors would think that investing in the Miller Opportunity Trust is not really rewarding.
On an as-reported basis, many of the companies in the fund are bad performers. The average as-reported ROA for the top 15 holdings of the fund is only 3%.
However, once we make Uniform Accounting adjustments to accurately calculate the earning power, we can see that the average return in Miller Opportunity Trust’s top 15 holdings is actually 13%.
As the distortions from as-reported accounting are removed, we can see that Alibaba (BABA) isn’t a 4% return business. Its Uniform ROA is 55%.
Meanwhile, Alphabet (GOOGL) looks like a 14% return business, but this big tech conglomerate actually powers a 37% Uniform ROA.
To find companies that can deliver alpha beyond the market, just finding companies where as-reported metrics misrepresent a company’s real profitability is insufficient.
To really generate alpha, any investor also needs to identify where the market is significantly undervaluing the company’s potential.
These dislocations demonstrate that most of these firms are in a different financial position than GAAP may make their books appear. But there is another crucial step in the search for alpha. Investors need to also find companies that are performing better than their valuations imply.
Valens has built a systematic process called Embedded Expectations Analysis to help investors get a sense of the future performance already baked into a company’s current stock price. Take a look:
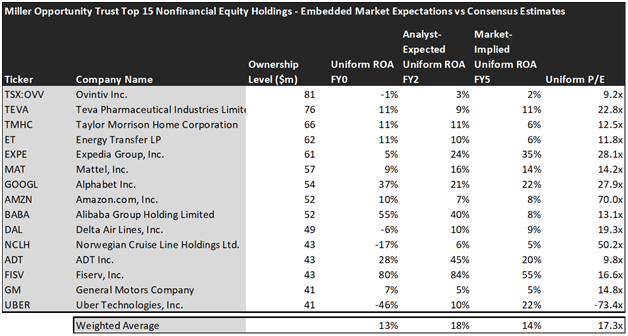
- The average Uniform ROA among Miller Opportunity Trust’s top 15 holdings is actually 13% which is around the corporate average in the United States.
- The analyst-expected Uniform ROA represents what ROA is forecasted to do over the next two years. To get the ROA value, we take consensus Wall Street estimates and convert them to the Uniform Accounting framework.
- The market-implied Uniform ROA is what the market thinks Uniform ROA is going to be in the three years following the analyst expectations, which for most companies here are 2023, 2024, and 2025. Here, we show the sort of economic productivity a company needs to achieve to justify its current stock price.
- The Uniform P/E is our measure of how expensive a company is relative to its Uniform earnings. For reference, the average Uniform P/E across the investing universe is roughly 20x.
Embedded Expectations Analysis of Miller Opportunity Trust paints a clear picture. Over the next few years, Wall Street analysts expect the companies in the fund to improve in profitability and the market agrees with analysts but is not that optimistic.
Analysts forecast the portfolio holdings on average to see Uniform ROA rise to 18% over the next two years. At current valuations, the market agrees with the analysts by expecting a 14% Uniform ROA for the companies in the portfolio.
For instance, the multinational fintech company Fiserv (FISV) returned 80% this year. Analysts think its returns will slightly improve to 84%. However, at a 16.6x Uniform P/E, the market expects a significant drop in profitability and is pricing Uniform ROA to be around 55%.
Similarly, ADT’s (ADT) Uniform ROA is 28%. Analysts expect its returns to rise to 45% but the market is pricing its returns to slightly decline to around 20%.
Overall, Miller Opportunity Trust has high-quality names that can continue to deliver high returns as expected from a great investor like Bill Miller. Also, the portfolio reflects his emphasis on capturing the mispriced opportunities that the market has not been pricing in. However, investors should analyze the current valuations and market expectations before making any investment decisions.
This just goes to show the importance of valuation in the investing process. Finding a company with strong profitability and growth is only half of the process. The other, just as important part, is attaching reasonable valuations to the companies and understanding which have upside which has not been fully priced into their current prices.
To see a list of companies that have great performance and stability also at attractive valuations, the Valens Conviction Long Idea List is the place to look. The conviction list is powered by the Valens database, which offers access to full Uniform Accounting metrics for thousands of companies.
Click here to get access.
Read on to see a detailed tearsheet of one of Miller Opportunity Trust’s largest holdings.
SUMMARY and Ovintiv Inc. Tearsheet
As one of Miller Opportunity Trust’s largest individual stock holdings, we’re highlighting Ovintiv Inc.’s (OVV:CAN) tearsheet today.
As the Uniform Accounting tearsheet for Ovintiv Inc. highlights, its Uniform P/E trades at 9.2x, which is below the global corporate average of 18.4x, and above its historical average of -1.0x.
Low P/Es require low EPS growth to sustain them. That said, in the case of Ovintiv Inc., the company has recently shown indefinite Uniform EPS growth.
Wall Street analysts provide stock and valuation recommendations that, in general, provide very poor guidance or insight. However, Wall Street analysts’ near-term earnings forecasts tend to have relevant information.
We take Wall Street forecasts for GAAP earnings and convert them to Uniform earnings forecasts. When we do this, Ovintiv Inc.’s Wall Street analyst-driven forecast is for EPS to shrink by 229% in 2022 and grow by 32% in 2023.
Furthermore, the company’s return on assets was -1% in 2021, which is below the long-run corporate averages. Also, cash flows and cash on hand consistently exceed its total obligations—including debt maturities and CAPEX maintenance. Moreover, its intrinsic credit risk is 90bps above the risk-free rate. Together, these signal low dividend risks and low credit risks.
Lastly, Ovintiv Inc.’s Uniform earnings growth is below peer averages, and in line with peer valuations.
Best regards,
Joel Litman & Rob Spivey
Chief Investment Strategist &
Director of Research
at Valens Research
This portfolio analysis highlights the same insights we share with our FA Alpha Members. To find out more, visit our website.