As concerns about a recession mount, investors are increasingly looking into dividend stocks for a defensive plan of action. Dividend payments can provide a steady income stream for investors, which can help offset potential investment losses during an economic downturn. The SPDR S&P 500 High Dividend ETF (SPYD) is an excellent way to gain exposure to the highest dividend-yielding stocks in the market, as it tracks a basket of high-paying dividend companies. In today’s FA Alpha Daily, we will use Uniform Accounting to examine SPYD’s top holdings and to determine if this strategy is feasible while entering a recession.
FA Alpha Daily:
Friday Portfolio Analysis
Powered by Valens Research
As we inch closer to a potential economic downturn, the desire to adopt a defensive investment strategy is becoming more prevalent for investors.
One such strategy involves investing in companies that not only hold the potential returns for stock price appreciation but also provide regular payments to investors.
These are the dividend stocks…
Investing in dividend stocks is viewed as a significant defensive investment strategy for several reasons.
First, companies that pay dividends tend to be more mature and established, often operating in stable industries.
These companies typically generate consistent cash flows, allowing them to distribute a portion of their earnings to shareholders in the form of dividend payments.
By investing in dividend stocks, investors can benefit from the cash flow generated by these companies, even if the stock price experiences temporary fluctuations.
The dividend payments received from investing in these companies also provide flexibility for investors.
These payments can be used for reinvesting or offsetting the losses incurred in a highly volatile market, which gives a sense of stability to investors during a challenging market environment.
To gain exposure to a well-diversified portfolio of high-dividend companies in the market, investors may consider the S&P 500 High Dividend ETF (ARCA:SPYD).
By investing in this ETF, investors can access a basket of the highest dividend-yielding stocks across various sectors, spreading their risk and potential rewards.
Let’s see the top holdings of this ETF and evaluate if it’s the right choice for the next recession.
Economic productivity is massively misunderstood on Wall Street. This is reflected by the 130+ distortions in the Generally Accepted Accounting Principles (GAAP) that make as-reported results poor representations of real economic productivity.
These distortions include the poor capitalization of R&D, the use of goodwill and intangibles to inflate a company’s asset base, a poor understanding of one-off expense line items, as well as flawed acquisition accounting.
It’s no surprise that once many of these distortions are accounted for, it becomes apparent which companies are in real robust profitability and which may not be as strong of an investment.
See for yourself below.
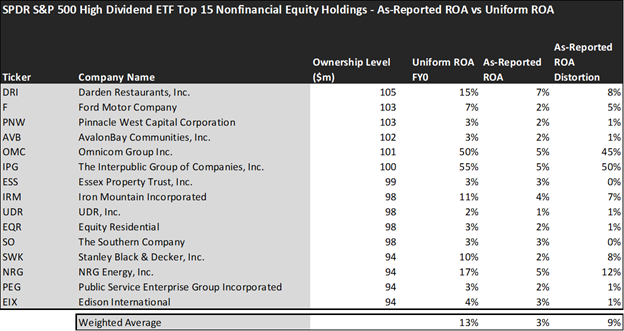
Looking at as-reported accounting numbers, investors would think that investing in an ETF that is composed of highly stable, regularly dividend-paying companies is resulting in below-average returns.
On an as-reported basis, many of the companies in the fund are poor performers. The average as-reported ROA for the top 15 holdings of the fund is 3%, which is way below the U.S. corporate average.
However, once we make Uniform Accounting adjustments to accurately calculate the earning power, we can see that the average return in SPDR S&P 500 High Dividend ETF’s top 15 holdings is actually 13%.
As the distortions from as-reported accounting are removed, we can see that Omnicom Group (OMC) isn’t a 5% return business. In fact, its Uniform ROA is 50%.
Meanwhile, The Interpublic Group (IPG) seems like a 5% return business as well, but this massive advertising company actually powers a 55% Uniform ROA.
That being said, to find companies that can deliver alpha beyond the market, just finding companies where as-reported metrics misrepresent a company’s real profitability is insufficient.
To really generate alpha, any investor also needs to identify where the market is significantly undervaluing the company’s potential.
These dislocations demonstrate that most of these firms are in a different financial position than GAAP may make their books appear. But there is another crucial step in the search for alpha. Investors need to also find companies that are performing better than their valuations imply.
Valens has built a systematic process called Embedded Expectations Analysis to help investors get a sense of the future performance already baked into a company’s current stock price. Take a look:
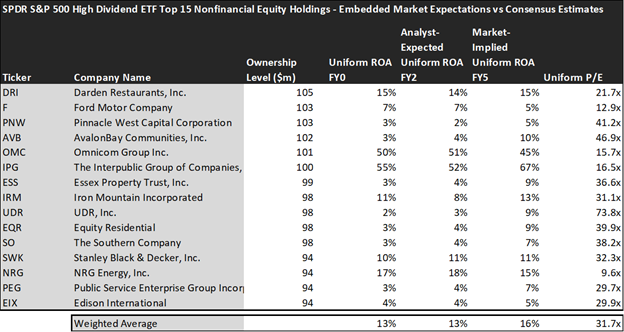
This chart shows four interesting data points:
- The average Uniform ROA among SPDR S&P 500 High Dividend ETF’s top 15 holdings is actually 13% which is slightly better than the corporate average in the United States.
- The analyst-expected Uniform ROA represents what ROA is forecasted to do over the next two years. To get the ROA value, we take consensus Wall Street estimates and convert them to the Uniform Accounting framework.
- The market-implied Uniform ROA is what the market thinks Uniform ROA is going to be in the three years following the analyst expectations, which for most companies here are 2023, 2024, and 2025. Here, we show the sort of economic productivity a company needs to achieve to justify its current stock price.
- The Uniform P/E is our measure of how expensive a company is relative to its Uniform earnings. For reference, the average Uniform P/E across the investing universe is roughly 20x.
Embedded Expectations Analysis of SPDR S&P 500 High Dividend ETF paints a clear picture. Over the next few years, Wall Street analysts expect the companies in the fund to remain at current levels. The market agrees with analysts but has slightly more optimistic views for the companies in the ETF.
Analysts forecast the portfolio holdings on average to see Uniform ROA maintain current levels of 13% over the next two years. At current valuations, the market’s expectations are in line with analysts and it expects a 16% Uniform ROA for the companies in the portfolio.
For instance, Pinnacle West Capital (PNW) returned 3% this year. Analysts think its returns will be around the same levels with a slight decline in profitability of around 2% return. At a 41.2x Uniform P/E, the market is pricing Uniform ROA to be around 5%.
Similarly, Edison International’s (EIX) Uniform ROA is 4%. Analysts expect its returns will remain flat at 4% and the market thinks it’ll be around the same levels as well with a 5% Uniform ROA.
Looking at the ETF’s top holdings, we can see that it’s composed of high-quality companies across various sectors and is well-diversified.
The only concern might be the ETF’s average Uniform P/E ratio, which is about 32 times. That’s higher than the market average of 20 times. Both analysts’ expectations and these companies’ current returns are in line with and at around the same levels as market expectations.
This might limit the upside for stock price appreciation in the near term. However, the advantage comes with regular dividend payments in this ETF, which might justify the higher-than-average valuations for the companies in the portfolio.
After analyzing the current valuations thoroughly, investors can choose either to invest in one of these stocks in the ETF or to buy the ETF directly to get a well-diversified portfolio amid a possible recession.
This just goes to show the importance of valuation in the investing process. Finding a company with strong profitability and growth is only half of the process. The other, just as important part, is attaching reasonable valuations to the companies and understanding which have upside which has not been fully priced into their current prices.
To see a list of companies that have great performance and stability also at attractive valuations, the Valens Conviction Long Idea List is the place to look. The conviction list is powered by the Valens database, which offers access to full Uniform Accounting metrics for thousands of companies.
Click here to get access.
Read on to see a detailed tearsheet of one of SPDR S&P 500 High Dividend ETF’s largest holdings.
SUMMARY and Darden Restaurants, Inc. Tearsheet
As one of SPDR S&P 500 High Dividend ETF’s largest individual stock holdings, we’re highlighting Darden Restaurants, Inc. (DRI:USA) tearsheet today.
As the Uniform Accounting tearsheet for Darden Restaurants, Inc. highlights, its Uniform P/E trades at 21.7x, which is above the global corporate average of 18.4x, and its historical average of 20.4x.
High P/Es require high EPS growth to sustain them. In the case of Darden Restaurants, Inc., the company has recently shown 56% Uniform EPS growth.
Wall Street analysts provide stock and valuation recommendations that, in general, provide very poor guidance or insight. However, Wall Street analysts’ near-term earnings forecasts tend to have relevant information.
We take Wall Street forecasts for GAAP earnings and convert them to Uniform earnings forecasts. When we do this, Darden Restaurants, Inc.’s Wall Street analyst-driven forecast is for EPS to grow by 7% and 10% in 2023 and 2024, respectively.
Furthermore, the company’s return on assets was 15% in 2022, which is 2x the long-run corporate averages. Also, cash flows and cash on hand consistently exceed its total obligations—including debt maturities and CAPEX maintenance. Moreover, its intrinsic credit risk is 80bps above the risk-free rate. Together, these signal low dividend risks and low credit risks.
Lastly, Darden Restaurants, Inc.’s Uniform earnings growth is in line with peer averages, and in line with peer valuations.
Best regards,
Joel Litman & Rob Spivey
Chief Investment Strategist &
Director of Research
at Valens Research
This portfolio analysis highlights the same insights we share with our FA Alpha Members. To find out more, visit our website.