Supply chain supercycle developments could increase demand for industrial companies’ services, which would boost their revenues and profitability. A popular way for investors to ride this wave has been the Industrial Select Sector SPDR Fund (XLI). In today’s FA Alpha, let’s take a look at XLI from a Uniform Accounting perspective and evaluate how it can provide value for investors.
FA Alpha Daily:
Friday Portfolio Analysis
Powered by Valens Research
The U.S. has remained underinvested in infrastructure for so many years. We need to renew our infrastructure and production capabilities to drive further growth in our country.
The supply-chain supercycle represents these investments and it is becoming increasingly important each day.
But there is a need for capital investments to renew this infrastructure and many facilities.
As interest rates went up to record levels that we have never seen in the last decade, the cost of these investments increased substantially as it’s usually powered by loans.
However, corporations are doing their best to cope with the situation and invest in their growth. We can see that from the growth in commercial and industrial (C&I) loans.
C&I loans have continued to rise this year even in a high-interest rate environment and recessionary concerns.
This means that the supply-chain supercycle is underway and there is one sector in particular that will be among the biggest winners of it, the industrials.
On Monday, we explained that the industrial sector can significantly benefit from the supply-chain supercycle and increased C&I loan growth.
Growing capital investments and developments in the supply chain supercycle could increase the demand for industrial companies’ services, which would be beneficial for their revenues and profitability.
For investors that want to ride this wave, The Industrial Select Sector SPDR Fund has been a popular way.
Considering these factors, let’s have a look at the top 15 holdings of the ETF using Uniform Accounting and evaluate its performance.
Economic productivity is massively misunderstood on Wall Street. This is reflected by the 130+ distortions in the Generally Accepted Accounting Principles (GAAP) that make as-reported results poor representations of real economic productivity.
These distortions include the poor capitalization of R&D, the use of goodwill and intangibles to inflate a company’s asset base, a poor understanding of one-off expense line items, as well as flawed acquisition accounting.
It’s no surprise that once many of these distortions are accounted for, it becomes apparent which companies are in real robust profitability and which may not be as strong of an investment.
See for yourself below.
Looking at as-reported accounting numbers, investors would think that investing in the industrial sector is not really rewarding.
On an as-reported basis, many of the companies in the ETF are poor performers. The average as-reported ROA for the top 15 holdings of the fund is 7%, which is lower than the U.S. corporate average of 12%.
However, once we make Uniform Accounting adjustments to accurately calculate earning power, we can see that the average return in the ETF’s top 15 holdings is actually 15%.
As the distortions from as-reported accounting are removed, we can see that Deere & Company’s (DE) isn’t a 6% return business. Its Uniform ROA is 21%.
Meanwhile, Lockheed Martin Corporation (LMT) looks like a 10% return business. This massive aerospace and defense company actually powers a 26% Uniform ROA.
To find companies that can deliver alpha beyond the market, just finding companies where as-reported metrics misrepresent a company’s real profitability is insufficient.
To really generate alpha, any investor also needs to identify where the market is significantly undervaluing the company’s potential.
These dislocations demonstrate that most of these firms are in a different financial position than GAAP may make their books appear. But there is another crucial step in the search for alpha. Investors need to also find companies that are performing better than their valuations imply.
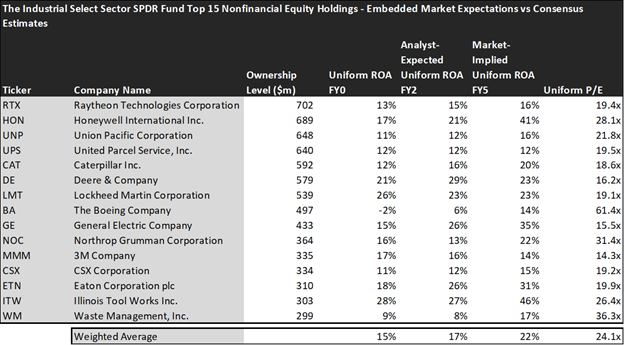
Valens has built a systematic process called Embedded Expectations Analysis to help investors get a sense of the future performance already baked into a company’s current stock price. Take a look:

This chart shows four interesting data points:
- The average Uniform ROA among The Industrial Select Sector SPDR Fund’s top 15 holdings is actually 15% which is slightly above the corporate average.
- The analyst-expected Uniform ROA represents what ROA is forecasted to do over the next two years. To get the ROA value, we take consensus Wall Street estimates and convert them to the Uniform Accounting framework.
- The market-implied Uniform ROA is what the market thinks Uniform ROA is going to be in the three years following the analyst expectations, which for most companies here are 2023, 2024, and 2025. Here, we show the sort of economic productivity a company needs to achieve to justify its current stock price.
- The Uniform P/E is our measure of how expensive a company is relative to its Uniform earnings. For reference, the average Uniform P/E across the investing universe is roughly 20x.
Embedded Expectations Analysis of The Industrial Select Sector SPDR Fund paints a clear picture. Over the next few years, Wall Street analysts expect the companies in the fund to slightly increase their profitability. The market also expects an increase in profitability but it is much more optimistic than analysts.
Analysts forecast the portfolio holdings on average to see Uniform ROA rise to 17% over the next two years. Meanwhile, the market agrees with the analysts on the rise but expects a 22% Uniform ROA for the companies in The Industrial Select Sector SPDR Fund’s portfolio.
For instance, Honeywell International (HON), the multinational conglomerate returned 17% this year. Analysts think its returns will increase and the company will record a 21% Uniform ROA over the next few years. However, the market’s expectation is much greater for the company and is pricing the Uniform ROA to be around 41%.
Similarly, General Electric’s (GE) Uniform ROA is 15%. Analysts are pricing its returns to rise to 26% and the market is pricing its returns to be around 35%.
Overall, the companies in The Industrial Select Sector SPDR Fund are high-quality names that can benefit from upcoming tailwinds like the supply chain supercycle.
But the problem is that the market is already pricing in for these tailwinds and expects these companies’ profitability to rise substantially. That is why investors should be careful about how and when to invest in these kinds of opportunities, along with a deep analysis of the valuations.
This just goes to show the importance of valuation in the investing process. Finding a company with strong profitability and growth is only half of the process. The other, just as important part, is attaching reasonable valuations to the companies and understanding which have upside which has not been fully priced into their current prices.
To see a list of companies that have great performance and stability also at attractive valuations, the Valens Conviction Long Idea List is the place to look. The conviction list is powered by the Valens database, which offers access to full Uniform Accounting metrics for thousands of companies.
Click here to get access.
Read on to see a detailed tearsheet of one of The Industrial Select Sector SPDR Fund’s largest holdings.
SUMMARY and Raytheon Technologies Corporation Tearsheet
As one of The Industrial Select Sector SPDR Fund’s largest individual stock holdings, we’re highlighting Raytheon Technologies Corporation’s (RTX:USA) tearsheet today.
As the Uniform Accounting tearsheet for Raytheon Technologies Corporation highlights, its Uniform P/E trades at 19.4x, which is around the global corporate average of 18.4x, but below its historical average of 21.4x.
Low P/Es require low EPS growth to sustain them. In the case of Raytheon Technologies Corporation, the company has recently shown 21% Uniform EPS growth.
Wall Street analysts provide stock and valuation recommendations that, in general, provide very poor guidance or insight. However, Wall Street analysts’ near-term earnings forecasts tend to have relevant information.
We take Wall Street forecasts for GAAP earnings and convert them to Uniform earnings forecasts. When we do this, Raytheon Technologies Corporation’s Wall Street analyst-driven forecast is for EPS to grow by 21% and 11% in 2022 and 2023, respectively.
Furthermore, the company’s return on assets was 13% in 2021, which is 2x the long-run corporate averages. Also, cash flows and cash on hand consistently exceed its total obligations—including debt maturities and CAPEX maintenance. Moreover, its intrinsic credit risk is 50bps above the risk-free rate. Together, these signal low dividend risks and low credit risks.
Lastly, Raytheon Technologies Corporation’s Uniform earnings growth is above peer averages, and below peer valuations.
Best regards,
Joel Litman & Rob Spivey
Chief Investment Strategist &
Director of Research
at Valens Research
This portfolio analysis highlights the same insights we share with our FA Alpha Members. To find out more, visit our website.