There are trillions of dollars being poured into ESG-focused funds from all around the world.
However, some ESG-focused funds are just focused on labeling themselves as ESG-focused—in reality, they’re ignoring ESG values to ride the marketing wave.
To cope with this issue, SEC formed a special ESG enhancement task force.
The SEC’s goal is to make sure that ESG funds are actually using a logical and sound method for determining ESG metrics, rather than just slapping on the label for greenwashing or virtue signaling.
One of the primary funds that have been targeted for this is DWS’s ESG Core Equity Fund.
The fund’s name includes the word “ESG” but it’s hard to speak positively about the ESG quality of its holdings. There are lots of “non-ESG” investments like Exxon Mobil (XOM) in the portfolio.
The fund has these kinds of “non-ESG” investments because of various criteria like promoting diversity and improving worker pay.
As a result of this issue, the SEC opened an investigation for DWS ESG Core Equity Fund for greenwashing allegations.
This was one of the significant reasons why the fund lost around 30% since last year’s highs.
Even though the fund may not be totally ESG-focused, it has some historical high performers that can deliver growth and profitability to its investors.
In this context, let’s see the DESS.X Mutual Fund through the Uniform Accounting perspective and how the fund has been holding up in these struggling times.
Economic productivity is massively misunderstood on Wall Street. This is reflected by the 130+ distortions in the Generally Accepted Accounting Principles (GAAP) that make as-reported results poor representations of real economic productivity.
These distortions include the poor capitalization of R&D, the use of goodwill and intangibles to inflate a company’s asset base, a poor understanding of one-off expense line items, as well as flawed acquisition accounting.
It is no surprise that once many of these distortions are accounted for, it becomes apparent which companies are in real robust profitability and which may not be as strong of an investment.
See for yourself below.
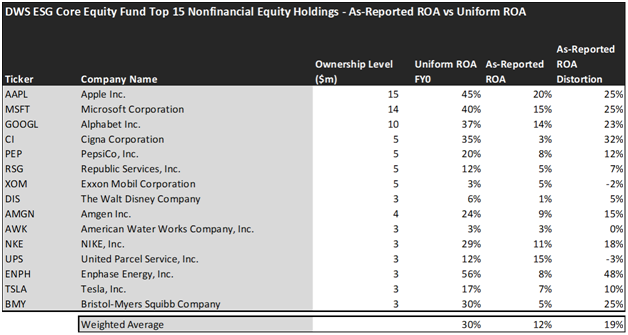
Using as-reported accounting, investors would think investing in a portfolio of not even real “ESG” companies is not really rewarding at all.
On an as-reported basis, many of these companies are moderate performers in terms of profitability and operate with an average as-reported ROA of 12%, which is equal to the corporate averages in the United States of 12%.
Once we make Uniform Accounting (UAFRS) adjustments to accurately calculate earning power, we can see that the returns of the companies in DWS ESG Core Equity Fund are much more robust.
Once the distortions from as-reported accounting are removed, we can realize that Apple (AAPL) doesn’t have 20% returns, but a Uniform ROA of 45%.
Similarly, Enphase Energy (ENPH) ROA is actually 56%, not 8%. Enphase Energy is an American energy technology company headquartered in Fremont, California that develops and manufactures solar micro-inverters, battery energy storage, and EV charging stations primarily for residential customers.
Cigna Corporation (CI) is another great example of as-reported metrics misrepresenting the company’s profitability. With a Uniform ROA of 35%, an as-reported ROA of 3% is wholly misleading to investors.
To find companies that can deliver alpha beyond the market, just finding companies where as-reported metrics misrepresent a company’s real profitability is insufficient.
To really generate alpha, any investor also needs to identify where the market is significantly undervaluing the company’s potential.
These dislocations demonstrate that most of these firms are in a different financial position than GAAP may make their books appear. But there is another crucial step in the search for alpha. Investors need to also find companies that are performing better than their valuations imply.
Valens has built a systematic process called Embedded Expectations Analysis to help investors get a sense of the future performance already baked into a company’s current stock price. Take a look:
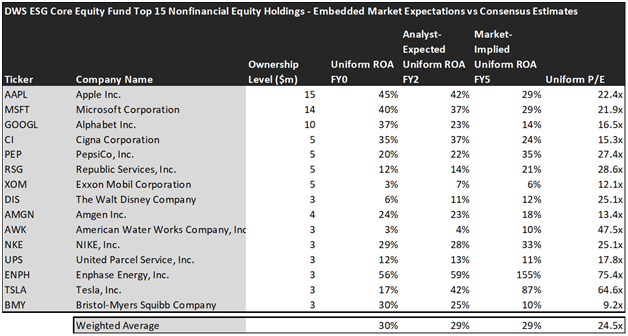
This chart shows four interesting data points:
- The Uniform ROA FY0 represents the company’s current return on assets, which is a crucial benchmark for contextualizing expectations.
- The analyst-expected Uniform ROA represents what ROA is forecasted to do over the next two years. To get the ROA value, we take consensus Wall Street estimates and convert them to the Uniform Accounting framework.
- The market-implied Uniform ROA is what the market thinks Uniform ROA is going to be in the three years following the analyst expectations, which for most companies here are 2023, 2024, and 2025. Here, we show the sort of economic productivity a company needs to achieve to justify its current stock price.
- The Uniform P/E is our measure of how expensive a company is relative to its Uniform earnings. For reference, the average Uniform P/E across the investing universe is roughly 20x.
Embedded Expectations Analysis of DWS ESG Core Equity Fund paints a clear picture. Over the next few years, Wall Street analysts expect the companies in DESS.X to slightly contract in profitability, and the market agrees.
Analysts forecast the fund on average to see Uniform ROA fall to 29% over the next two years, and the market is also pricing the industry to see returns fall to approximately the same level as analysts, which may imply that the fund’s holdings are on average being correctly priced by the market.
However, there are a couple of companies that may lead investors to be cautious.
The markets are expecting Tesla’s (TSLA) Uniform ROA to rise to 87%. Meanwhile, analysts are projecting the company’s returns to increase to 42%, perhaps disappointing investors.
PepsiCo (PEP) may further disappoint investors as analysts expect their returns to slightly improve to 22% Uniform ROA, while the market expects them to increase their returns to 35%.
Overall, the portfolio is composed of high-quality names which are known for their historical success. For investors who are not very concerned about ESG principles but want to be exposed to the popular ESG trend along with holding up some high-quality stocks, DWS ESG Core Equity Fund could be ideal. However, before making any investment decision, investors should be careful about the valuation and analyze accordingly.
This just goes to show the importance of valuation in the investing process. Finding a company with strong growth is only half of the process. The other, just as important part, is attaching reasonable valuations to the companies and understanding which have upside which has not been fully priced into their current prices.
To see a list of companies that have great performance and stability also at attractive valuations, the Valens Conviction Long Idea List is the place to look. The conviction list is powered by the Valens database, which offers access to full Uniform Accounting metrics for thousands of companies.
Click here to get access.
Read on to see a detailed tearsheet of one of DWS ESG Core Equity Fund’s largest holdings.
SUMMARY and Apple Inc. Tearsheet
As one of DWS ESG Core Equity Fund’s largest individual stock holdings, we’re highlighting Apple Inc. (AAPL:USA) tearsheet today.
As the Uniform Accounting tearsheet for Apple highlights, its Uniform P/E trades at 22.4x, which is above the global corporate average of 18.9x, and its historical average of 19.5x.
Average P/Es require average EPS growth to sustain them. That said, in the case of Apple, the company has recently shown 72% Uniform EPS growth.
Wall Street analysts provide stock and valuation recommendations that, in general, provide very poor guidance or insight. However, Wall Street analysts’ near-term earnings forecasts tend to have relevant information.
We take Wall Street forecasts for GAAP earnings and convert them to Uniform earnings forecasts. When we do this, Apple’s Wall Street analyst-driven forecast is for EPS to grow by 8% and 1% in 2022 and 2023, respectively.
Furthermore, the company’s return on assets was 45% in 2021, which is above the long-run corporate averages. Also, cash flows and cash on hand consistently exceed its total obligations—including debt maturities and CAPEX maintenance. Moreover, its intrinsic credit risk is 10bps above the risk-free rate. Together, these signal low credit risks.
Lastly, Apple’s Uniform earnings growth is in line with peer averages, and trading above peer valuations.
Best regards,
Joel Litman & Rob Spivey
Chief Investment Strategist &
Director of Research
at Valens Research
This portfolio analysis highlights the same insights we share with our FA Alpha Members. To find out more, visit our website.