2022 has been a difficult year for financial markets, interest rates have reached record highs, and geopolitical crises have caused uncertainty in the markets.
Investors saw losses wherever they looked, S&P500 fell around 16% so far and bonds have not been profitable.
But there is one sector that shines like a diamond among all the negativity in financial markets, which is the energy sector.
Due to supply constraints and the Ukraine-Russia war, crude oil and natural gas prices have soared, making many energy companies generate impressive returns.
The sector has shown strong performance by gaining over 50% year to date, thus becoming the investor’s favorite in 2022.
According to UBS’s Billionaire Ambitions Report 2022, the energy sector has become the billionaires’ favorite as well.
The survey shows the energy industry took the top place among other sectors for future business opportunities and investments.
Billionaires want to cash in as opportunities in the sector are increasing due to new trends and developments, such as the Shale Revolution and the increased importance of liquefied natural gas (LNG).
For investors that want to be exposed to the industry, The Energy Select Sector SPDR Fund has been one of the best ways to do so.
In this context, let’s have a look at the top 15 holdings of the ETF by utilizing the Uniform Accounting framework.
Economic productivity is massively misunderstood on Wall Street. This is reflected by the 130+ distortions in the Generally Accepted Accounting Principles (GAAP) that make as-reported results poor representations of real economic productivity.
These distortions include the poor capitalization of R&D, the use of goodwill and intangibles to inflate a company’s asset base, a poor understanding of one-off expense line items, as well as flawed acquisition accounting.
It’s no surprise that once many of these distortions are accounted for, it becomes apparent which companies are in real robust profitability and which may not be as strong of an investment.
See for yourself below.
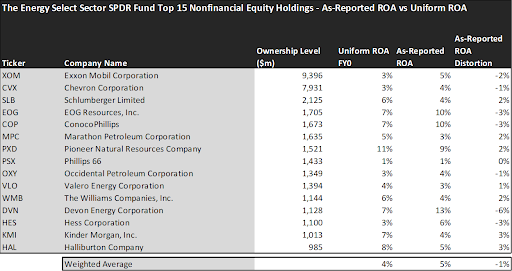
On an as-reported basis, many of the companies in the ETF are poor performers. The average as-reported ROA for the top holdings of the ETF is 5%.
Once we make Uniform Accounting adjustments to accurately calculate earning power, we can see that the average return in The Energy Select Sector SPDR Fund’s top holdings is 4%, which shows that the ETF’s top holdings are slightly worse performers than it seems.
As the distortions from as-reported accounting are removed, we can see that EOG Resources (EOG) isn’t a 10% return business. Its Uniform ROA is 7%. Meanwhile, Devon Energy Corporation (DVN) looks like a 13% return business when it actually is only half of that, as the company’s Uniform ROA is 7%.
To find companies that can deliver alpha beyond the market, just finding companies where as-reported metrics misrepresent a company’s real profitability is insufficient.
To really generate alpha, any investor also needs to identify where the market is significantly undervaluing the company’s potential.
These dislocations demonstrate that most of these firms are in a different financial position than GAAP may make their books appear. But there is another crucial step in the search for alpha. Investors need to also find companies that are performing better than their valuations imply.
Valens has built a systematic process called Embedded Expectations Analysis to help investors get a sense of the future performance already baked into a company’s current stock price. Take a look:
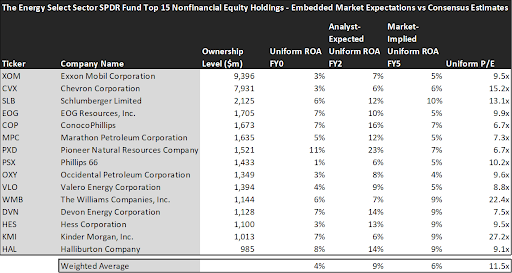
This chart shows four interesting data points:
- The average Uniform ROA among The Energy Select Sector SPDR Fund’s top 15 holdings is actually 4% which is below the corporate average.
- The analyst-expected Uniform ROA represents what ROA is forecasted to do over the next two years. To get the ROA value, we take consensus Wall Street estimates and convert them to the Uniform Accounting framework.
- The market-implied Uniform ROA is what the market thinks Uniform ROA is going to be in the three years following the analyst expectations, which for most companies here are 2023, 2024, and 2025. Here, we show the sort of economic productivity a company needs to achieve to justify its current stock price.
- The Uniform P/E is our measure of how expensive a company is relative to its Uniform earnings. For reference, the average Uniform P/E across the investing universe is roughly 20x.
Embedded Expectations Analysis of The Energy Select Sector SPDR Fund paints a clear picture. Over the next few years, Wall Street analysts expect the companies in the fund to significantly increase their profitability and the market’s expectations are in line with analysts.
Analysts forecast the portfolio holdings on average to see Uniform ROA rise to 9% over the next two years. Meanwhile, the market agrees with the analysts for the companies in The Energy Select Sector SPDR Fund’s portfolio.
For instance, Halliburton (HAL), the second largest oil field service company in the world returned 8% this year. Analysts think its returns will increase and the company will record a 14% Uniform ROA over the next few years and the market expects the same from the company.
Similarly, Phillips 66’s (PSX) Uniform ROA is only 1%. Analysts are pricing its returns to rise to 6% and the market is pricing its returns to be around the same level.
Overall, The Energy Select Sector SPDR Fund consists of high-quality companies for investors wanting to be exposed to the energy sector.
However, the market is already pricing in the improvements in profitability and its upcoming tailwinds. That leaves not much room for further upside potential for investors to benefit from. That is why a detailed analysis is a necessity for a cyclical industry like the energy sector. There are lots of opportunities in the energy industry but investors should carefully look at the valuations and should analyze the upside potential.
This just goes to show the importance of valuation in the investing process. Finding a company with strong profitability and growth is only half of the process. The other, just as important part, is attaching reasonable valuations to the companies and understanding which have upside which has not been fully priced into their current prices.
To see a list of companies that have great performance and stability also at attractive valuations, the Valens Conviction Long Idea List is the place to look. The conviction list is powered by the Valens database, which offers access to full Uniform Accounting metrics for thousands of companies.
Click here to get access.
Read on to see a detailed tearsheet of one of The Energy Select Sector SPDR Fund’s largest holdings.
SUMMARY and Chevron Corporation Tearsheet
As one of The Energy Select Sector SPDR Fund’s largest individual stock holdings, we’re highlighting Chevron Corporation’s (CVX:USA) tearsheet today.
As the Uniform Accounting tearsheet for Chevron Corporation highlights, its Uniform P/E trades at 22.0x, which is above the global corporate average of 18.4x, and its historical average of 5.2x.
High P/Es require high EPS growth to sustain them. In the case of Chevron Corporation, the company has recently shown 200% Uniform EPS shrinkage.
Wall Street analysts provide stock and valuation recommendations that, in general, provide very poor guidance or insight. However, Wall Street analysts’ near-term earnings forecasts tend to have relevant information.
We take Wall Street forecasts for GAAP earnings and convert them to Uniform earnings forecasts. When we do this, Chevron Corporation’s Wall Street analyst-driven forecast is for EPS to grow by 193% in 2022 and shrink by 24% in 2023.
Furthermore, the company’s return on assets was 3% in 2021, which is below the long-run corporate averages. Also, cash flows and cash on hand consistently exceed its total obligations—including debt maturities and CAPEX maintenance. Moreover, its intrinsic credit risk is 20bps above the risk-free rate. Together, these signal moderate dividend risks and low credit risks.
Lastly, Chevron Corporation’s Uniform earnings growth is in line with peer averages, and above peer valuations.
Best regards,
Joel Litman & Rob Spivey
Chief Investment Strategist &
Director of Research
at Valens Research
This portfolio analysis highlights the same insights we share with our FA Alpha Members. To find out more, visit our website.