Macro hedge funds came out of the woodwork in January to brag about their fantastic 2022 gains.
Rather than making bets on specific companies or industries, macro hedge funds predict how the economy will move. For instance, they position themselves for or against certain currencies… or bet on where inflation and interest rates will go.
Macro hedge fund Odey Asset Management is a prime example of a firm that got it right — sort of.
London-based Odey made a big bet that inflation and political turmoil would hurt England’s economy. It was right.
The fund’s huge short positions on U.K. government bonds led to a record 152% return last year. That was more than double its second-best performance, which was in 1993. And it helped the fund recoup its negative 68% returns generated from 2015 to 2020.
A 152% return sounds impressive. However, that’s only half the story.
You see, like many other macro funds, Odey has been betting on inflation for years. And until now, it has been wrong.
The root cause of inflation was the supply-chain crisis. It wasn’t about monetary policy like macro funds expected. So while they ended up being right about inflation (eventually), it was mostly a lucky guess.
Evidently, just because a fund made a lot of money doesn’t mean it knows what it’s doing.
Odey has gone silent since gloating about last year’s performance, until recently. The firm made major headlines again, but not in a good way.
Crispin Odey has been severed, from the firm, in light of sexual assault allegations, and everything appears to be crumbling apart.
Notably, there had been “advanced discussions” regarding the transferring of funds and staff to other firms.
If that was not enough, sizable levels of redemption requests forced management to put a halt on money withdrawals and influenced the closing of one of its funds.
It’s been a hectic year for Odey thus far, so let’s dive into the fund’s top 15 holdings and see if Odey can replicate 2022 returns despite the mass uncertainty it currently faces.
Economic productivity is massively misunderstood on Wall Street. This is reflected by the 130+ distortions in the Generally Accepted Accounting Principles (GAAP) that make as-reported results poor representations of real economic productivity.
These distortions include the poor capitalization of R&D, the use of goodwill and intangibles to inflate a company’s asset base, a poor understanding of one-off expense line items, as well as flawed acquisition accounting.
It’s no surprise that once many of these distortions are accounted for, it becomes apparent which companies are in real robust profitability and which may not be as strong of an investment.
See for yourself below.
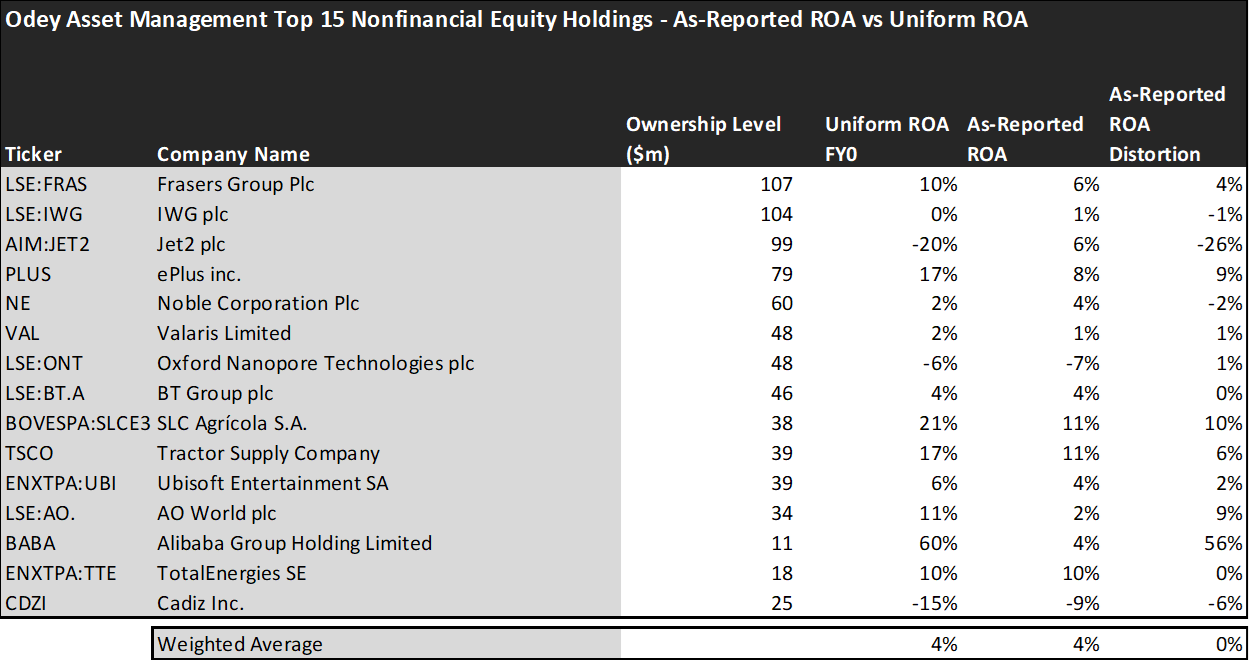
Looking at as-reported accounting numbers, investors would see that Odey Asset Management invests in some low-quality companies.
On an as-reported basis, many of the companies in the fund are significantly below-average performers. The average as-reported ROA for the top 15 holdings of the fund is 4%, which is way lower than the 12% U.S. corporate average.
As we make the Uniform Accounting adjustments, we can see that the average return in Odey Asset Management’s top 15 holdings is actually similar to the profitability that as-reported metrics show, which is coming in at 4%.
While the difference between as-reported and Uniform metrics may not be highly visible on a weighted average basis for this fund, it can be seen that there are significant differences on an individual company basis.
For instance, low-cost British airline Jet2 (AIM:JET2) looks like a 6% return business, but it’s actually highly unprofitable with a -20% Uniform ROA.
That being said, to find companies that can deliver alpha beyond the market, just finding companies where as-reported metrics misrepresent a company’s real profitability is insufficient.
To really generate alpha, any investor also needs to identify where the market is significantly undervaluing the company’s potential.
These dislocations demonstrate that most of these firms are in a different financial position than GAAP may make their books appear. But there is another crucial step in the search for alpha. Investors need to also find companies that are performing better than their valuations imply.
Valens has built a systematic process called Embedded Expectations Analysis to help investors get a sense of the future performance already baked into a company’s current stock price. Take a look:

This chart shows four interesting data points:
- The average Uniform ROA among Odey Asset Management’s top 15 holdings is actually 4%, which is below the corporate average in the United States.
- The analyst-expected Uniform ROA represents what ROA is forecasted to do over the next two years. To get the ROA value, we take consensus Wall Street estimates and convert them to the Uniform Accounting framework.
- The market-implied Uniform ROA is what the market thinks Uniform ROA is going to be in the three years following the analyst expectations, which for most companies here are 2023, 2024, and 2025. Here, we show the sort of economic productivity a company needs to achieve to justify its current stock price.
- The Uniform P/E is our measure of how expensive a company is relative to its Uniform earnings. For reference, the average Uniform P/E across the investing universe is roughly 20x.
Embedded Expectations Analysis of Odey Asset Management paints a clear picture. Over the next few years, Wall Street analysts expect the companies in the fund to rise in levels of profitability. Similarly, the market has expectations for these companies to surpass their current performance.
Analysts forecast the portfolio holdings on average to see Uniform ROA increase to 12% over the next two years. At current valuations, the market’s expectations are similar to analysts and it expects an 11% Uniform ROA for the companies in the portfolio.
For instance, Valaris (VAL) returned 2% this year. Analysts anticipate its returns largely increase to about 20%. The market seems more optimistic about the company’s future returns and its pricing in its profitability will increase even further to 42% Uniform ROA.
Similarly, Noble (NE) has a Uniform ROA of 2%. Analysts expect its returns to increase to 23%, and the market has a similar view about the company and pricing its returns to be around 27%.
Most of the companies in the fund are barely returning beyond the average cost of capital. Additionally, the companies that show potential in the future, are already being priced in by market expectations.
Notably, Valaris and Noble are two energy companies that are poised for growth in the future, though they are highly expensive. Market expectations in this situation, like other companies in the portfolio, are limiting any upside. For an energy company, they are being priced beyond their counterparts, therefore there seems to be no real value here.
Another alarming issue within the portfolio is that one of the fund’s top holdings is IWG, a work-space company. The two problems here are that office spaces are dying due to remote options, and its biggest competitor WeWork (WE) spent the last few months navigating around bankruptcy.
WeWork and IWG utilize a very similar business model, so if WeWork is struggling, that is not a great sign for IWG. That’s why the company didn’t make any money last year.
In all, there seems to be a wide disconnect between the holdings in the company. There doesn’t seem to be a clear investment strategy. The companies in the portfolio are just overall not great performers.
This doesn’t seem to be a big surprise though when you look at Odey as a fund. Odey got lucky to be breakeven over the last decade. Structurally, like its portfolio, there is a lot of chaos and uncertainty revolving around the future. Odey’s founder has been cut out, they had only one good year since 2015, and investors are trying to withdraw funds.
Don’t allow the 2022 performance to mask the underlying issues of this fund. In its current state, the firm has no clear direction in the company as a whole as well as the holding within its portfolio.
It would be best to let the fire die down and reassess in the future.
This just goes to show the importance of valuation in the investing process. Finding a company with strong profitability and growth is only half of the process. The other, just as important part, is attaching reasonable valuations to the companies and understanding which have upside which has not been fully priced into their current prices.
To see a list of companies that have great performance and stability at attractive valuations, the Valens Conviction Long Idea List is the place to look. The conviction list is powered by the Valens database, which offers access to full Uniform Accounting metrics for thousands of companies.
Click here to get access.
Read on to see a detailed tearsheet of one of Odey Asset Management’s largest holdings.
SUMMARY and IWG plc Company Tearsheet
As one of Odey Asset Management’s largest individual stock holdings, we’re highlighting IWG plc (IWG:GBR) tearsheet today.
As the Uniform Accounting tearsheet for IWG plc highlights, its Uniform P/E trades at 53.5x, which is above the global corporate average of 18.4x, but below its historical average of 86.5x.
High P/Es require high EPS growth to sustain them. In the case of IWG plc, the company has recently shown 2,070% Uniform EPS growth.
Wall Street analysts provide stock and valuation recommendations that, in general, provide very poor guidance or insight. However, Wall Street analysts’ near-term earnings forecasts tend to have relevant information.
We take Wall Street forecasts for GAAP earnings and convert them to Uniform earnings forecasts. When we do this, IWG plc’s Wall Street analyst-driven forecast is for EPS to shrink by 41% and 42% in 2023 and 2024, respectively.
Furthermore, the company’s return on assets was immaterial in 2022, which is below the long-run corporate averages. Also, cash flows and cash on hand exceed its total obligations—including debt maturities and CAPEX maintenance. These signal moderate operating risk and moderate credit risk.
Lastly, IWG plc’s Uniform earnings growth is in line with peer averages, and in line with peer valuations.
Best regards,
Joel Litman & Rob Spivey
Chief Investment Strategist &
Director of Research
at Valens Research
This portfolio analysis highlights the same insights we share with our FA Alpha Members. To find out more, visit our website.