Every day we do common tasks such as reading the news, meeting people, and shopping.
Today, we do all of those activities on the internet, creating a digital trail. Every transaction we make, every word we search on the internet, and every step we take are recorded somewhere to be utilized later.
The pace at which we generate digital footprints gets higher as well—90% of the data in the world was generated over the last two years alone.
Companies may use this data to optimize their processes, provide tailored products for customers or create wide-sweeping business strategies.
But there is another very important use: understanding the economy.
The modern economy thrives on data, and the most important data is the one that shows how the economy itself hums.
One might think that banks have the necessary data to work on and understand what is going on, and it might be true. However, no company can see spending trends in aggregate like the credit card players can.
Mastercard (MA) and its competitor Visa (V) are the heads of the payment duopoly, and create the network that powers commerce globally.
They have the data of almost every transaction people make with their cards, and the ability to gain insights from it.
What does the distribution of spending look like? Which sectors are earning more and when? What are the trends in consumer behavior?
Answers to these questions require the huge amount of data that these companies have.
However, this power does not seem to make much return. As-reported metrics fail to convince investors that the business is truly leveraging its data-rich position.
As-reported return on assets (“ROA”) of Mastercard was stable at around 20% until the start of the pandemic in 2020.
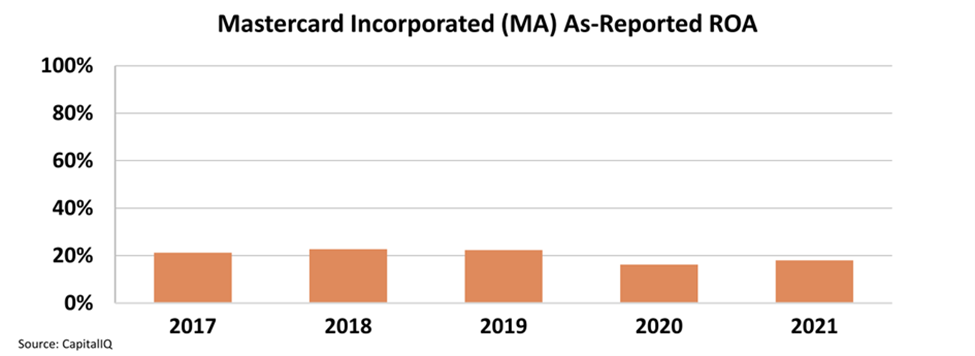
Having such power and being one of the top two companies in an essential industry should allow Mastercard to achieve higher profitability.
However, this ROA chart is not accurate. This is due to distortions in as-reported accounting and can be fixed by making the over 130 adjustments needed under Uniform Accounting.
In reality, Mastercard is minting money by leveraging its position at the top and using the huge data it has.
The Uniform ROA of the company has been much higher than suggested by the as-reported metrics. It jumped from 63% in 2017 to 83% in 2019 before the Covid began.
Even after the huge drop in 2020 when Uniform ROA was 52%, it recovered quickly and jumped to 79% in 2021.
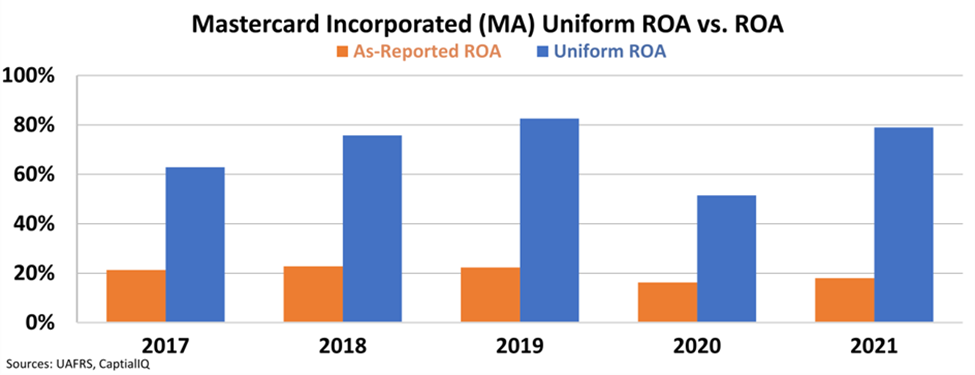
Just as Mastercard sells and leverages the correct data to answer questions about the economy, investors need the correct data to understand the real performance of companies.
Uniform Accounting allows investors to see how profitable Mastercard’s business is and that it is actually improving, contrary to what the as-reported metrics make it look like.
SUMMARY and Mastercard Incorporated Tearsheet
As the Uniform Accounting tearsheet for Mastercard Incorporated (MA:USA) highlights, the Uniform P/E trades at 28.9x, which is above the global corporate average of 19.3x, but below its own historical P/E of 36.1x.
High P/Es require high EPS growth to sustain them. In the case of Mastercard, the company has recently shown a 31% growth in Uniform EPS.
Wall Street analysts provide stock and valuation recommendations that in general provide very poor guidance or insight. However, Wall Street analysts’ near-term earnings forecasts tend to have relevant information.
We take Wall Street forecasts for GAAP earnings and convert them to Uniform earnings forecasts. When we do this, Mastercard’s Wall Street analyst-driven forecast is a 22% and 19% EPS growth in 2022 and 2023, respectively.
Based on the current stock market valuations, we can use earnings growth valuation metrics to back into the required growth rate to justify Mastercard’s $344 stock price. These are often referred to as market embedded expectations.
The company is currently being valued as if Uniform earnings were to grow by 7% annually over the next three years. What Wall Street analysts expect for Mastercard’s earnings growth is above what the current stock market valuation requires through 2023.
Furthermore, the company’s earning power in 2021 is 13x the long-run corporate average. Moreover, cash flows and cash on hand are 5x its total obligations—including debt maturities, capex maintenance, and dividends. All in all, this signals low credit and dividend risk.
Lastly, Mastercard’s Uniform earnings growth is above its peer averages, and the company is also trading above its average peer valuations.
Best regards,
Joel Litman & Rob Spivey
Chief Investment Strategist &
Director of Research
at Valens Research
The Uniform Accounting insights in today’s issue are the same ones that power some of our best stock picks and macro research, which can be found in our FA Alpha Daily newsletters.