Crescent Energy specializes in acquiring low-decline oil and gas assets within the U.S., focusing on fields that naturally sustain longer production with less intensive methods. This allows for more favorable purchase negotiations in markets with reduced competition. In today’s FA Alpha Daily, let’s look at the company’s strategic positioning in leveraging their assets that ensures continued operational viability and creating lasting value.
FA Alpha Daily:
Wednesday Credit
Powered by Valens Research
Oil and gas production from existing fields and wells declines naturally over time if no additional investment is made.
This production decline curve shows the steep drop in oil and gas volumes that can be expected from a field each year. Left unaddressed, decline rates can be as high as 10-15% annually for conventional oil and gas assets.
However, certain assets experience slower and more gradual production declines.
These “low-decline” assets tend to have shallower underground reservoirs or require less intensive production methods like natural gas rather than oil. As a result, their yearly output decreases at a more modest 5-8% rate even without reinvestment.
Crescent Energy (CRGY) is a strategic acquirer focused on these types of low-decline oil and gas assets in the United States.
By targeting fields and wells with slower production tapering, Crescent can acquire assets with long operational lifespans remaining.
This enables the company to find acquisition opportunities that have been overlooked by other buyers chasing only the highest initial output deals.
Crescent also looks for sellers operating in geographic areas where there is a lack of competitive bidding.
With fewer potential acquirers in those regions, Crescent can negotiate purchases at more attractive prices. This strategy of acquiring undervalued, low-decline assets has paid off for Crescent.
The company was able to lift its ROA from 3% in 2019 to a robust 14% in 2022.
However, Crescent’s series of large acquisitions over the past year have concerned some ratings agencies.
S&P gave the company a “B+” rating, indicating a significant risk of default at nearly 25% over the next five years. It also puts the company in the risky high-yield basket.
Given its solid financial standing, we believe Crescent deserves a more secure rating.
We can figure out if there is a real risk for this company by leveraging the Credit Cash Flow Prime (“CCFP”) to understand how the company’s obligations match against its cash and cash flows.
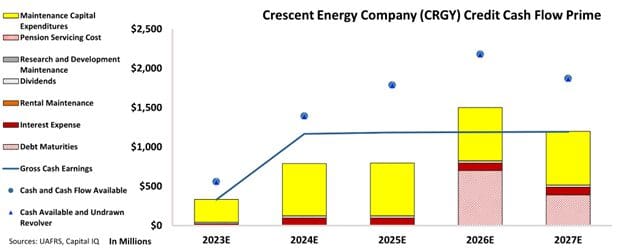
In the chart below, the stacked bars represent the firm’s obligations each year for the next five years. These obligations are then compared to the firm’s cash flow (blue line) as well as the cash on hand available at the beginning of each period (blue dots) and available cash and undrawn revolver (blue triangles).
The CCFP chart shows that Crescent’s reserve cash and cash flows are more than enough to serve all its obligations going forward.

The chart indicates that the company is on solid financial ground and is very likely to fulfill its obligations with ease in the next five years.
The company has debt maturities coming in 2026 and 2027 but its substantial cash flows and cash on hand should easily cover all of its obligations.
Moreover, by continuing its strategy of strategic low-decline asset purchases, Crescent also has opportunities to sustain high profitability levels over the long run. This could help the firm consolidate its position as these assets become more valuable.
Our review of Crescent shows that the company has a low risk of default, contrary to what rating agencies indicate.
Therefore, we are assigning an “IG3+” rating to the company, which places it in the investment-grade basket, with a risk of default of only about 1%.
It is our goal to bring forward the real creditworthiness of companies, built on the back of better Uniform Accounting.
To see Credit Cash Flow Prime ratings for thousands of companies, click here to learn more about the various subscription options now available for the full Valens Database.
SUMMARY and Crescent Energy Company (CRGY:USA) Tearsheet
As the Uniform Accounting tearsheet for Crescent Energy Company (CRGY:USA) highlights, the Uniform P/E trades at 10.1x, which is below the global corporate average of 22.4x, but above its historical P/E of 5.6x.
Low P/Es require low EPS growth to sustain them. In the case of Crescent, the company has recently shown a 133% Uniform EPS shrinkage.
Wall Street analysts provide stock and valuation recommendations, that in general, provide very poor guidance or insight. However, Wall Street analysts’ near-term earnings forecasts tend to have relevant information.
We take Wall Street forecasts for GAAP earnings and convert them to Uniform earnings forecasts. When we do this, Crescent’s Wall Street analyst-driven forecast is for a 104% and 921% EPS shrinkage in 2023 and 2024, respectively.
Based on the current stock market valuations, we can use earnings growth valuation metrics to back into the required growth rate to justify Crescent’s $12 stock price. These are often referred to as market-embedded expectations.
Furthermore, the company’s earning power in 2022 was 2x the long-run corporate average. Moreover, cash flows and cash on hand are 2x its total obligations—including debt maturities and capex maintenance. The company also has an intrinsic credit risk that is 320bps above the risk-free rate.
Overall, this signals a moderate credit risk.
Lastly, Crescent’s Uniform earnings growth is below its peer averages and is trading in line with its average peer valuations.
Best regards,
Joel Litman & Rob Spivey
Chief Investment Strategist &
Director of Research
at Valens Research
This analysis of Crescent Energy (CRGY)’s credit outlook is the same type of analysis that powers our macro research detailed in the member-exclusive FA Alpha Pulse.
