Cathie Wood built a name for herself when the stock picks for her ARK ETF skyrocketed amidst the market frenzy in 2020 and 2021. Today’s FA Alpha Daily will dissect if the fund’s current holdings continue to have high growth potential after the recent reversal for the fund.
FA Alpha Daily:
Friday Portfolio Analysis
Powered by Valens Research
Cathie Wood has been known for her proclivity for defying what traditional investors consider sound investing.
Rather, she has been known for making bold bets, with pronouncements that often sharply contrast with typical sentiments at the time.
As the entire market went berserk and ratcheted up in 2020 and 2021, her stock picks seemed like magic out of a genie’s lamp.
The narrative changes as investors take a step back and look at the big picture, even if it’s challenging to do so when caught up in the thrill of surging equity values.
Even with a stellar run for two years, her ETF has underperformed its benchmark by 900 basis points on an annualized basis.
While most investors would pare their losses, Wood instead has come out and proclaimed her picks are in “deep value” territory. Much to the chagrin of much of the investing community, the ARK ETF has somehow had inflows this year despite posting huge losses.
With consistent underperformance in its history, this may come as a shock. However, a deeper look highlights why she remains so bullish.
She recently paid a hefty sum to buy out a partner from her funds when her AUM was nearly at all-time highs, and as a result, she has no option but to maintain perpetual rosiness about her holdings.
With the market sliding in recent weeks, now is a good time to take a look at the performance, growth, and valuations of Cathie Wood’s holdings in the ARK ETF. That way, we can get a sense of what Wall Street and the markets are pricing into the future of U.S. growth equities that she has invested in, and see if her holdings warrant her aggression.
Economic productivity is massively misunderstood on Wall Street. This is reflected by the 130+ distortions in the Generally Accepted Accounting Principles (GAAP) that make as-reported results poor representations of real economic productivity.
These distortions include the poor capitalization of R&D, the use of goodwill and intangibles to inflate a company’s asset base, a poor understanding of one-off expense line items, as well as flawed acquisition accounting.
It is no surprise that once many of these distortions are accounted for, it becomes apparent which companies are in reality robustly profitable and which may not be as strong of an investment.
Contrary to what one might expect with the collapse of many of Wood’s holdings in recent months, many of the holdings in the ETF remain in a better position than you would expect.
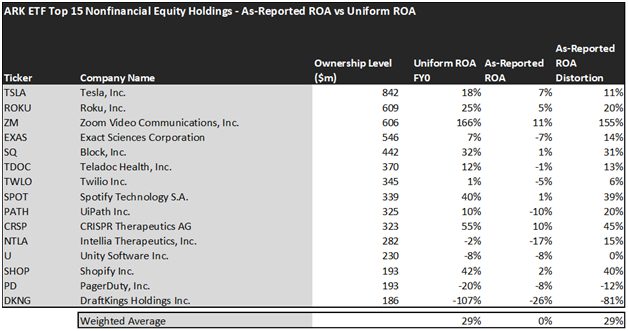
The average as-reported ROA among the ARK ETF top 15 names is immaterial. In other words, these companies appear to be destroying value by operating. In reality, though, these companies are much more profitable, with a 29% Uniform ROA.
One of the fund’s largest holding Roku (ROKU) for example, doesn’t return measly below cost of capital returns of 5%. It actually provides drastically stronger returns, at a 25% Uniform ROA. This takes into account the strong pivot to digital subscriptions the streaming industry has seen.
Some of its other investments are also much stronger than they appear. For example, Zoom Communications (ZM) does not have 11% returns. Rather, it has a 166% Uniform ROA as the face of the virtual workplace.
Furthermore, Spotify Technology (SPOT) doesn’t have a barely profitable return of 1%. Rather, it has immensely strong returns of 40%, which is representative of its place as the leader in music and podcast streaming.
Largely, once we account for Uniform Accounting adjustments, we can see that many of these companies are strong stocks that are priced to grow at strong rates or are fairly priced.
These dislocations demonstrate that most of these firms are in a different financial position than GAAP may make their books appear. But there is another crucial step in the search for alpha. Investors need to also find companies that are performing better than their valuations imply.
Valens has built a systematic process called Embedded Expectations Analysis to help investors get a sense of the future performance already baked into a company’s current stock price. Take a look:
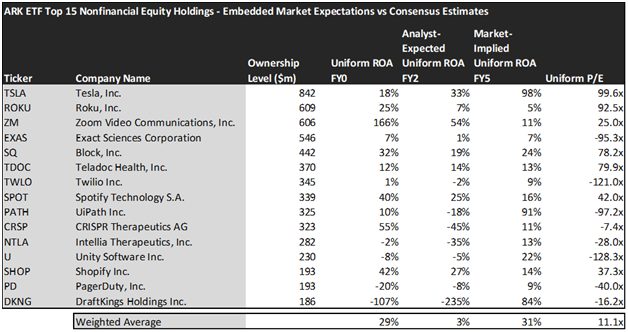
This chart shows four interesting data points:
- The Uniform ROA FY0 represents the company’s current return on assets, which is a crucial benchmark for contextualizing expectations.
- The analyst-expected Uniform ROA represents what ROA is forecasted to do over the next two years. To get the ROA value, we take consensus Wall Street estimates and we convert them to the Uniform Accounting framework.
- The market-implied Uniform ROA is what the market thinks Uniform ROA is going to be in the three years following the analyst expectations, which for most companies here is 2023, 2024, and 2025. Here, we show the sort of economic productivity a company needs to achieve to justify its current stock price.
- The Uniform P/E is our measure of how expensive a company is relative to its Uniform earnings. For reference, average Uniform P/E across the investing universe is roughly 24x.
Embedded Expectations Analysis of the ARK ETF paints a clear picture of the fund. The stocks it tracks are projected by analysts to drop and become below average return holdings. However, the market is pricing these companies to continue being highly profitable companies.
In other words, Cathie Wood may be left out in the cold when the market realizes how expensive these names are. Unlike analysts that are expecting average ROA to drop to 3%, the market is pricing these companies to see economic profitability grow to 31%.
UiPath (PATH) is poised to collapse in profitability and valuation, with analyst expectations of -18% ROA being the opposite direction of market expectations of 91%.
Similarly, DraftKings (DKNG) should also continue its current trajectory. While the market is projecting them to become a wildly profitable company with an 84% Uniform ROA, analysts expect them to continue their descent to a -235% Uniform ROA company.
While the market is preaching that this is just a great time to “buy the dip”, a look at the true financials shows that many of these high growth names aren’t as sure a bet as Cathie Wood is making them out to be.
This just goes to show the importance of valuation in the investing process to understand the underlying story. Finding a company with strong growth is only half of the process. The other, just as important part, is attaching reasonable valuations to the companies and understanding which have upside which have not been fully priced into their current prices.
To see a list of companies that have great performance and stability also at attractive valuations, the Valens Conviction Long Idea List is the place to look. The conviction list is powered by the Valens database, which offers access to full Uniform Accounting metrics for thousands of companies.
Click here to get access.
Read on to see a detailed tearsheet of the largest holding in the ARK ETF.
SUMMARY and Tesla, Inc. Tearsheet
As ARK’s largest individual stock holdings, we’re highlighting Tesla, Inc. (TSLA:USA) tearsheet today.
As the Uniform Accounting tearsheet for Tesla highlights, its Uniform P/E trades at 99.6x, which is above the global corporate average of 24.0x, but below its historical average of 101.8x.
High P/Es require high EPS growth to sustain them. In the case of Tesla, the company has recently shown a Uniform EPS growth of 1,421%.
Wall Street analysts provide stock and valuation recommendations that in general provide very poor guidance or insight. However, Wall Street analysts’ near-term earnings forecasts tend to have relevant information.
We take Wall Street forecasts for GAAP earnings and convert them to Uniform earnings forecasts. When we do this, Tesla’s Wall Street analyst-driven forecast is a 90% and 30% EPS growth in 2022 and 2023, respectively.
Based on the current stock market valuations, we can use earnings growth valuation metrics to back into the required growth rate to justify Tesla’s $770 stock price. These are often referred to as market embedded expectations.
The company is currently being valued as if Uniform earnings were to grow by 59% annually over the next three years. What Wall Street analysts expect for Tesla’s earnings growth is above what the current stock market valuation requires in 2022, but below that requirement in 2023.
Meanwhile, the company’s earning power is 3x the long-run corporate average. Moreover, cash flows and cash on hand are 4x its total obligations—including debt maturities and capex maintenance. Also, intrinsic credit risk is 20bps. Together, these signal low operating and credit risks.
Lastly, Tesla’s Uniform earnings growth is above its peer averages, and the company is also trading above its average peer valuations.
Best regards,
Joel Litman & Rob Spivey
Chief Investment Strategist &
Director of Research
at Valens Research
This portfolio analysis highlights the same insights we use to power our FA Alpha product. To find out more visit our website.