Throughout financial market history, many of the world’s most successful investors have been candid in their belief that Generally Accepted Accounting Principles (“GAAP”) distort economic reality.
Warren Buffett, for example, once said investors should “concentrate on the world of companies, not arcane accounting mathematics.”
Investors who neglect the very real issues with as-reported accounting can find themselves caught up investing with the crowd, blindly following hot “themes” without a thorough grasp of how to understand the businesses in question.
The only true way to focus on the “world of companies,” as Buffett suggests investors do, is to present a clear picture of how a business operates, something that can only be done by adjusting financial statements to reflect the arbitrary nature of certain accounting rules that leave much to discretion.
The world’s best investors understand the need to make these adjustments, which allows them to focus not on picking out the most popular companies, but rather looking for great names in sleepy areas that the market isn’t paying much attention to. From there, the goal is to then identify quality companies with significant growth potential at reasonable prices.
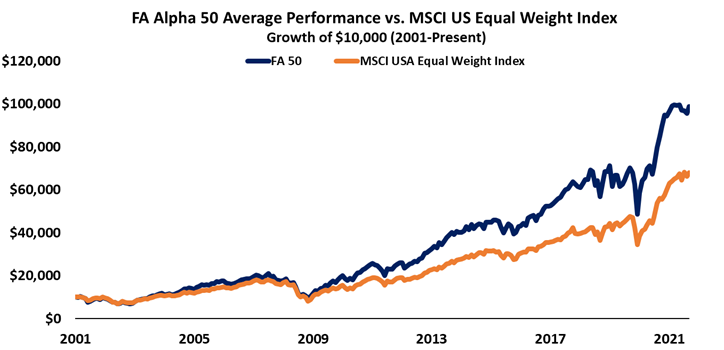
That’s exactly what we’ve set out to do with the FA Alpha, our monthly list of 50 companies that rank at the top for quality, high growth, and low valuations.
This list has outperformed the market by 300bps per year for over 20 years now, effectively doubling the performance of the market by focusing on the real fundamentals and valuations of companies with our proprietary Uniform Accounting framework.
See for yourself below.
While many investors are already looking past the pandemic, the repercussions of spending trend shifts from 2020 will continue to reverberate for years to come.
As everyone stayed at home, the way people spent their time and money shifted. People bought more things, and as long-distance travel practically came to a halt, people looked for more local travel activities.
Along with this spike in interest for local travel came the desire for people or families to travel on their own. As opposed to renting vehicles or using trains and planes, people turned to cars.
This caused a surge in demand for cars. As people moved into the automobile reliant suburbs, and wanted to avoid large crowds, cars saw record high demand. However, supply chain issues into 2021 meant manufacturers couldn’t secure enough microchips for today’s smarter cars. As this made it difficult to buy new cars, people turned to used ones.
Cars.com (CARS) lets customers chase down the scarce inventory of used cars on the market. One might expect it to perform exceptionally well in a time when demand for used vehicles is through the roof.
Yet on an as-reported basis, return on assets (ROA) was just 1% in 2020, when demand was at all-time highs.
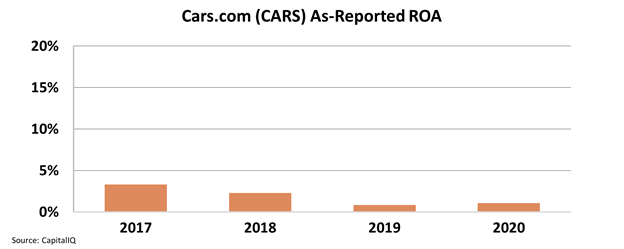
For a company to see returns below cost-of-capital levels during a period of high high demand almost defies logic. It is no wonder then many investors wrote off Cars.com as a failing company.
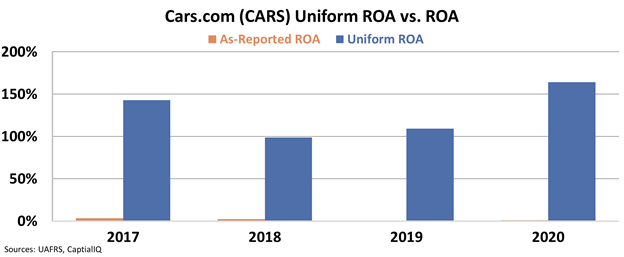
However, with a closer look using Uniform Accounting, we see a very different picture, and one that makes much more sense.
As Cars.com acts as a marketplace business, it has few assets. This means most earnings are compounded to high returns. Combined with the surging demand for vehicles, ROA should have significantly increased.
Uniform ROA shows us that is exactly what happened, with returns rocketing to 160% in 2020, almost 50% higher than 2019’s returns.
Cars.com was also able to reinvest in its booming marketplace and grow its assets by almost 10%.
In a year when demand for cars was high, Cars.com performed at its best.
As-reported metrics completely missed how strong cars.com performance was, which may be part of the reason the company is trading at only a 9.8x P/E.
With strong returns, a robust economic moat, robust growth, and low valuations, no wonder it’s a compelling FA Alpha idea. This high-quality market leader in its industry is inexpensively priced and growing aggressively, which is exactly why our FA Alpha Screen discovered the name.
To see the other 49 names on the list, click here.
SUMMARY and Cars.com Inc. Tearsheet
As the Uniform Accounting tearsheet for Cars.com Inc. (CARS:USA) highlights, the Uniform P/E trades at 9.8x, which is below the global corporate average of 24.0x, but around its historical P/E of 9.5x.
Low P/Es require low EPS growth to sustain them. In the case of Cars.com, the company has recently shown 78% Uniform EPS growth.
Wall Street analysts provide stock and valuation recommendations that in general provide very poor guidance or insight. However, Wall Street analysts’ near-term earnings forecasts tend to have relevant information.
We take Wall Street forecasts for GAAP earnings and convert them to Uniform earnings forecasts. When we do this, Cars.com’s Wall Street analyst-driven forecast is a 44% EPS decline in 2021 and an 8% EPS growth in 2022.
Based on the current stock market valuations, we can use earnings growth valuation metrics to back into the required growth rate to justify Cars.com’s $15 stock price. These are often referred to as market embedded expectations.
The company is currently being valued as if Uniform earnings were to shrink 21% annually over the next three years. What Wall Street analysts expect for Cars.com’s earnings growth is below what the current stock market valuation requires in 2021, but above that requirement in 2022.
The company’s earning power in 2020 is 27x above the long-run corporate average. Furthermore, cash flows and cash on hand are 2x its total obligations—including debt maturities and capex maintenance. Also, intrinsic credit risk is 300bps above the risk free rate.
All in all, this signals average credit risk.
Lastly, Cars.com’s Uniform earnings growth is below its peer averages and the company is trading below its average peer valuations.
Best regards,
Joel Litman & Rob Spivey
Chief Investment Strategist &
Director of Research
at Valens Research
Today’s highlight, Cars.com Inc. is one of the top stock picks from FA Alpha 50 this month. To see more stock picks like this, get access to FA Alpha 50.