The hedge fund industry’s growing willingness to spend millions of dollars to recruit top talent is driven by the belief that top performers can generate significant returns for investors. The high cost of recruiting top talent is leading some hedge funds to explore new, cheaper ways to compete, such as using artificial intelligence (AI) to manage investment funds. AIEQ, an AI-managed ETF powered by IBM Watson, claims to match the skill and capacity of 1,000 research analysts. In today’s FA Alpha Daily, will take a look at what AIEQ ETF is investing in to see if it can live up to its claims.
FA Alpha Daily:
Friday Portfolio Analysis
Powered by Valens Research
The war for talent in the hedge fund is escalating.
These funds are heavily performance-based. Therefore, if a manager is historically known to generate profits, it becomes an all-out money brawl.
This became clear when David Lipner of Millennium Management threatened to leave the firm, and was surprisingly counteracted with “a one-year paid sabbatical and an incentive upon return.”
Tons of money is being poured into top talent, but this brings into question who is assuming these fees.
Evidently, recruitment costs come at the expense of the clients.
Customers are footing the bills of these massive payouts through blank fees and expenses, some of which can be used for compensation, research, and even entertainment.
Management fees are rising. Traditionally, funds would receive one-third of profits with clients getting the remainder. Now, investors are only getting 45% of the returns on average from investments.
Industry dynamics are changing, but a new Artificial Intelligence (AI) tool could calm this storm—AI Powered Equity ETF (AIEQ).
This ETF is driven by AI and powered by the IBM Watson system. Designed to answer questions posed in natural language, this ETF uses it to simulate the work of a team of 1,000 research analysts, traders, and quants.
The basis of the tool is very similar to Marshall Wace’s TOPS strategy, where the best “sell-side” strategies are used to compile a portfolio. However, AEIQ cuts down the middle steps and is fully driven by artificial intelligence.
In short, AI technology builds projection models on over 6,000 US companies, each considering four different points of data to quantify future potential: Financials, News and Information, Management, and Macro.
Each of these models has underlying signals that interact with each other to create a portfolio of 30 to 200 companies with the greatest appreciation potential over the next twelve months.
The AI Powered Equity ETF aims for long-term capital growth and strives to outperform the overall U.S. equity market with maximum risk-adjusted return.
Due to the nature of the investment process and fee structures, ETFs are almost always less expensive than investing in hedge funds. Furthermore, there are often capital requirements for investing through a hedge fund.
That said, if AI capabilities are able to replicate the work of analysts, there could be much divergence from the recent hedge fund manager war. ETFs could begin to develop a larger cost edge on these industry giants.
Now, let’s take a look at the fund’s top holdings and see if this AI tool can back its claims and promise a successful alternative to human-managed funds.
Economic productivity is massively misunderstood on Wall Street. This is reflected by the 130+ distortions in the Generally Accepted Accounting Principles (GAAP) that make as-reported results poor representations of real economic productivity.
These distortions include the poor capitalization of R&D, the use of goodwill and intangibles to inflate a company’s asset base, a poor understanding of one-off expense line items, as well as flawed acquisition accounting.
It’s no surprise that once many of these distortions are accounted for, it becomes apparent which companies are in real robust profitability and which may not be as strong of an investment.
See for yourself below.
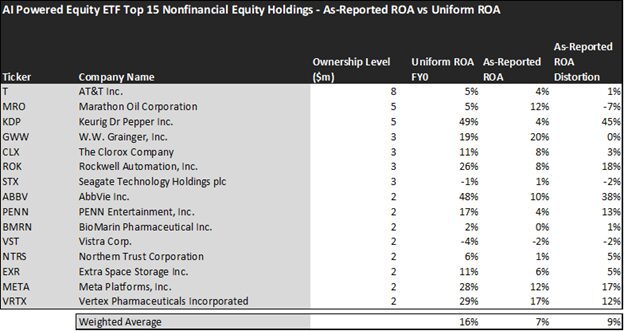
Looking at as-reported accounting numbers, investors would see that the AI Powered Equity ETF (AIEQ) invests in relatively low-quality companies.
On an as-reported basis, many of the companies in the fund are notably below-average performers. The average as-reported ROA for the top 15 holdings of the fund is 7%, which is way lower than the 12% U.S. corporate average.
However, once we make Uniform Accounting adjustments to accurately calculate the earning power, we can see that the average return in the AI Powered Equity ETFs top 15 holdings is significantly more profitable than what as-reported metrics show, which is coming in at 16%.
As the distortions from as-reported accounting are removed, we can see that Keurig Dr Pepper Inc. (KDP) isn’t a 4% return business. Its Uniform ROA is 49%.
Meanwhile, Rockwell Automation (ROK) seems like an 8% return business, but this industrial automation company powers a 26% Uniform ROA.
That being said, to find companies that can deliver alpha beyond the market, just finding companies where as-reported metrics misrepresent a company’s real profitability is insufficient.
To really generate alpha, any investor also needs to identify where the market is significantly undervaluing the company’s potential.
These dislocations demonstrate that most of these firms are in a different financial position than GAAP may make their books appear. But there is another crucial step in the search for alpha. Investors need to also find companies that are performing better than their valuations imply.
Valens has built a systematic process called Embedded Expectations Analysis to help investors get a sense of the future performance already baked into a company’s current stock price. Take a look:
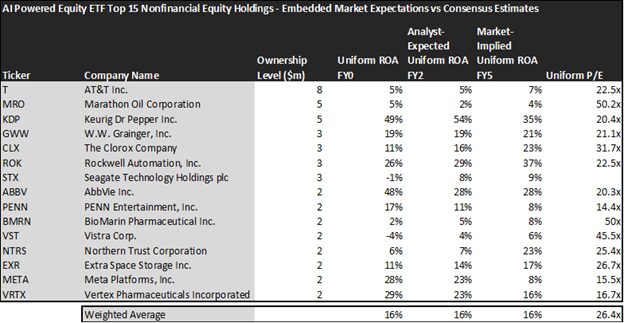
This chart shows four interesting data points:
- The average Uniform ROA among AIEQ’s top 15 holdings is actually 16%, which is above the corporate average in the United States.
- The analyst-expected Uniform ROA represents what ROA is forecasted to do over the next two years. To get the ROA value, we take consensus Wall Street estimates and convert them to the Uniform Accounting framework.
- The market-implied Uniform ROA is what the market thinks Uniform ROA is going to be in the three years following the analyst expectations, which for most companies here are 2023, 2024, and 2025. Here, we show the sort of economic productivity a company needs to achieve to justify its current stock price.
- The Uniform P/E is our measure of how expensive a company is relative to its Uniform earnings. For reference, the average Uniform P/E across the investing universe is roughly 20x.
Embedded Expectations Analysis of AIEQ paints a clear picture. Over the next few years, Wall Street analysts expect the companies in the fund to remain at the same levels of profitability.
Similarly, the market has expectations for these companies to stay on track with current valuations.
Analysts forecast the portfolio holdings on average to see Uniform ROA stay at 16% over the next two years. At current valuations, the market has the same expectations as analysts and it expects a 16% Uniform ROA for the companies in the portfolio as well.
For instance, AT&T Inc. (T) returned 5% this year. Analysts anticipate its returns to stay at 5%. The market seems to think almost the same about the company’s future and its pricing in a slight improvement in profitability to reach a Uniform ROA of 7%.
Similarly, W.W. Grainger, Inc. (GWW) has a Uniform ROA of 19%. Analysts expect its returns to remain at 19%, and the market has a similar view about the company and pricing its returns to be around 21%.
In understanding the potential and current capabilities of this AI tool, it’s important to connect the underlying models with the companies that it holds within its portfolio.
Firstly, when looking at how the portfolio is constructed of companies that are outperforming the corporate average, it’s safe to say that AIEQ is able to choose financially healthy companies. This speaks to the function of its financial and management models.
Evidently, the algorithm/model has been selected and filtered for companies that are stable and have no structural problems as well as sound financials.
Companies like Keurig Dr Pepper (KDP), AbbVie (ABBV), and Rockwell Automation (ROK) are all yielding more than 25% ROA’s which is a positive indication that the financial and management aspect of the model is operating sufficiently.
Secondly, on the macro side, the tool seems to have a good understanding of the current market conditions as well as potential future macro outcomes.
Yet again, Keurig Dr Pepper is an excellent example of a company that is positioned to be resilient in the recessionary conditions as suggested by the market. Packaged food and consumer staple companies, like Keurig Dr Pepper, typically perform well in stressful environments, as their products are not pricey and remain in demand for people’s everyday lives.
While not clearly stated, it makes sense why the macro model would suggest a company like Keurig Dr Pepper to be in the portfolio.
Lastly, PENN Entertainment, Inc. (PENN) can speak to AIEQ’s news and information model. The market is pricing the company to fall from a current ROA of 17% down to 8% in the future. However, the news model has seemingly picked up on the potential PENN has given its most recent $2 billion deal with ESPN to be its exclusive sports betting partner.
ESPN is a world leader in sports, making this deal a big thing for PENN. AIEQ’s model most likely understands that which is why we see this name in the top 15 holdings of the company.
When deciding whether this ETF is worth the investment, it’s important to contextualize the potential of the holdings and understand the driving factors for their inclusion in the portfolio.
From a broad perspective, it appears that AIEQ is doing what it claims to do.
Hedge fund managers are spending millions on salaries when this tool has shown promise that it can replicate the work of 1,000 analysts. While it’s still in its early stage, be sure to keep track of AIEQ’s performance as it could be an investment ahead of its time.
This just goes to show the importance of valuation in the investing process. Finding a company with strong profitability and growth is only half of the process. The other, just as important part, is attaching reasonable valuations to the companies and understanding which have upside which has not been fully priced into their current prices.
To see a list of companies that have great performance and stability at attractive valuations, the Valens Conviction Long Idea List is the place to look. The conviction list is powered by the Valens database, which offers access to full Uniform Accounting metrics for thousands of companies.
Click here to get access.
Read on to see a detailed tearsheet of one of AI Powered Equity ETF’s largest holdings.
SUMMARY and AT&T Inc. Tearsheet
As one of AI Powered Equity ETF’s largest individual stock holdings, we’re highlighting AT&T Inc. (T:USA) tearsheet today.
As the Uniform Accounting tearsheet for AT&T Inc. highlights, its Uniform P/E trades at 22.5x, which is above the global corporate average of 18.4x, but around its historical average of 24.5x.
High P/Es require high EPS growth to sustain them. In the case of AT&T Inc., the company has recently shown 59% Uniform EPS growth.
Wall Street analysts provide stock and valuation recommendations that, in general, provide very poor guidance or insight. However, Wall Street analysts’ near-term earnings forecasts tend to have relevant information.
We take Wall Street forecasts for GAAP earnings and convert them to Uniform earnings forecasts. When we do this, AT&T Inc.’s Wall Street analyst-driven forecast is for EPS to shrink by 46% in 2023 and to grow by 3% in 2024.
Furthermore, the company’s return on assets was 5% in 2022, which is below the long-run corporate averages. Also, cash flows and cash on hand exceed its total obligations—including debt maturities and CAPEX maintenance. These signal moderate dividend risk and low credit risk.
Lastly, AT&T Inc.’s Uniform earnings growth is in line with peer averages, and in line with peer valuations.
Best regards,
Joel Litman & Rob Spivey
Chief Investment Strategist &
Director of Research
at Valens Research
U.S. stocks are in CODE RED–and you’re about to learn why! We are inviting you to attend our upcoming event this Wednesday, October 4, 2023 at 12:00 PM CT to learn how to protect your wealth in the oncoming stock market crash.
This portfolio analysis highlights the same insights we share with our FA Alpha Members. To find out more, visit our website.