When you have conviction, the best way to win big is to bet big. That’s exactly what they taught at Tiger Management.
Tiger was among the most iconic and influential hedge funds of all time.
Even though the fund itself has been shut down since March 2000, it bred some of the most prominent funds and managers of the current generation.
Maverick Capital is no exception.
Maverick was founded by tiger cub Lee Ainslie in 1993. His approach has always involved making big bets, specifically in the tech sector.
Along with its public investments, Ainslie put his know-how in the tech industry to work and formed a venture capital arm of his fund to invest in early-stage companies.
While all these investments in tech have been bringing incredible returns for the last few years and investors were enjoying the golden times of the fund, they have taken a beating this year.
Just like Tiger Global, which lost two-thirds of its all-time gains this year, Maverick is down 32% through the end of May.
Growth is among the most important drivers for tech stocks without question, and in order to support high growth levels, companies need cheap credit.
With the Fed rapidly raising rates, unprofitable tech companies can’t feast on cheap debt.
That is why, in this current economic environment, tech stocks have been getting crushed and giving a difficult time for the funds that are heavily concentrated in this industry.
To be able to see if things are as bad as it sounds for Maverick Capital, we’re going to take a deeper look into their holdings through Uniform Accounting.
Economic productivity is massively misunderstood on Wall Street. This is reflected by the 130+ distortions in the Generally Accepted Accounting Principles (GAAP) that make as-reported results poor representations of real economic productivity.
These distortions include the poor capitalization of R&D, the use of goodwill and intangibles to inflate a company’s asset base, a poor understanding of one-off expense line items, as well as flawed acquisition accounting.
It is no surprise that once many of these distortions are accounted for, it becomes apparent which companies are in real robust profitability and which may not be as strong of an investment.
See for yourself below.
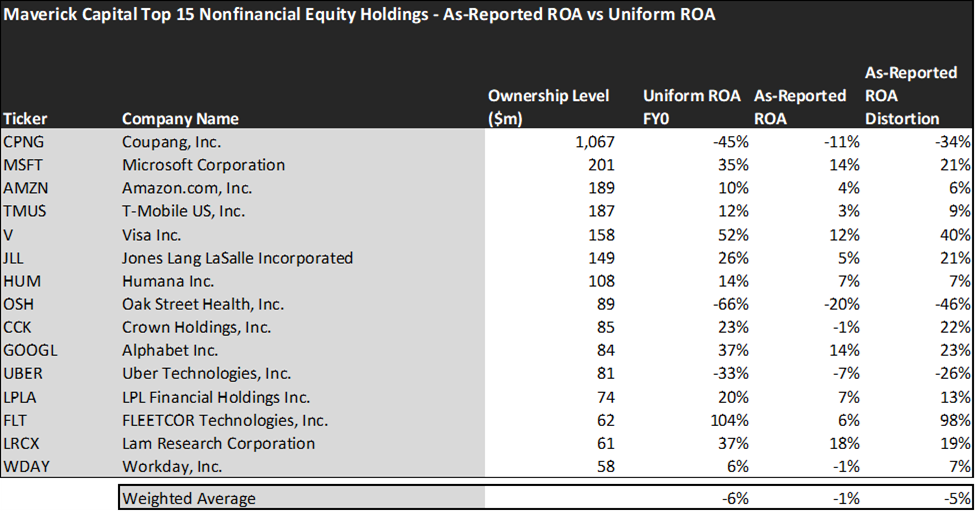
On an as-reported basis, Maverick’s holdings don’t look too bad. The fund’s average ROA is nearly profitable at -1%.
However, once we make Uniform Accounting (UAFRS) adjustments to accurately calculate earning power, we can see that the returns of the companies in the Maverick Capital, the situation is worse.
The average return is actually -6%, more steeply negative. In particular, one of the biggest distortions comes from Maverick’s biggest holding, Coupang (CPNG). Coupang doesn’t have an ROA of -11%, It has a -45% Uniform ROA.
Coupang is Maverick’s top holding by a longshot, and it’s more than three times in the red than as-reported metrics would suggest.
Similarly, Uber’s (UBER) ROA is actually -33%, not -7%. Oak Street Health’s (OSH) Uniform ROA is -66%, not -20%.
To find companies that can deliver alpha beyond the market, just finding companies where as-reported metrics mis-represent a company’s real profitability is insufficient.
To really generate alpha, any investor also needs to identify where the market is significantly undervaluing the company’s potential.
Once we account for Uniform Accounting adjustments, we can see that many of these companies are strong stocks but have already realized most of their potential.
These dislocations demonstrate that most of these firms are in a different financial position than GAAP may make their books appear. But there is another crucial step in the search for alpha. Investors need to also find companies that are performing better than their valuations imply.
Valens has built a systematic process called Embedded Expectations Analysis to help investors get a sense of the future performance already baked into a company’s current stock price. Take a look:
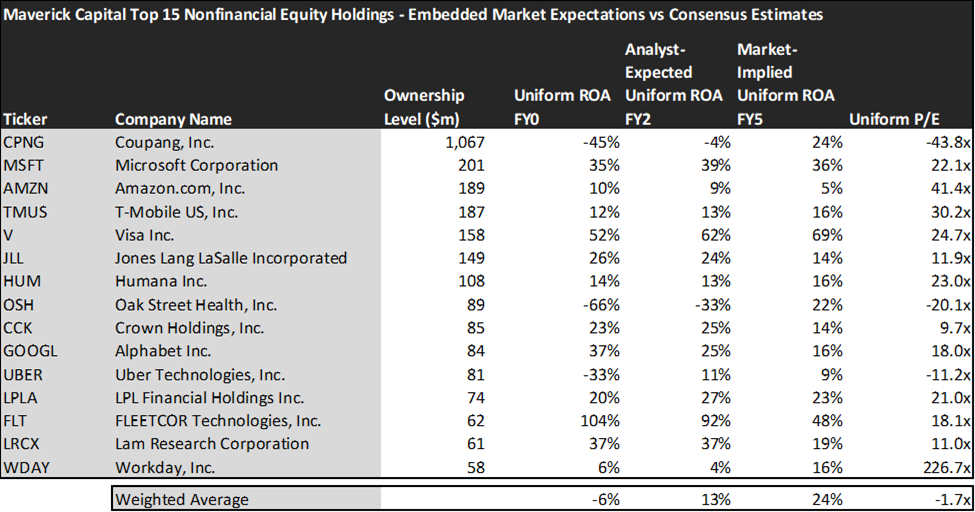
This chart shows three interesting data points:
- The Uniform ROA FY0 represents the company’s current return on assets, which is a crucial benchmark for contextualizing expectations.
- The analyst-expected Uniform ROA represents what ROA is forecasted to do over the next two years. To get the ROA value, we take consensus Wall Street estimates and convert them to the Uniform Accounting framework.
- The market-implied Uniform ROA is what the market thinks Uniform ROA is going to be in the three years following the analyst expectations, which for most companies here is 2023, 2024, and 2025. Here, we show the sort of economic productivity a company needs to achieve to justify its current stock price.
Embedded Expectations Analysis of Maverick Capital paints a clear picture of the fund. While the stocks it tracks are strong performers historically, the markets are pricing them to increase their profitability, while analysts are not that optimistic.
While analysts forecast the fund to see Uniform ROA rise to 13% over the next two years, the market is pricing the fund to see returns increase to 24% levels, which may lead to more downside risk.
In particular, there are a couple of companies that may lead investors to be cautious.
The markets are expecting Oak Street Health’s Uniform ROA to rise to 22%. Meanwhile, analysts are projecting the company’s returns to increase from -66% to -33%.
Coupang’s stock is priced to see the company’s Uniform ROA reach 24%, but analysts think returns will stay negative.
This just goes to show the importance of valuation in the investing process. Finding a company with strong growth is only half of the process. The other, just as important part, is attaching reasonable valuations to the companies and understanding which have upside which have not been fully priced into their current prices.
To see a list of companies that have great performance and stability also at attractive valuations, the Valens Conviction Long Idea List is the place to look. The conviction list is powered by the Valens database, which offers access to full Uniform Accounting metrics for thousands of companies.
Click here to get access.
Read on to see a detailed tearsheet of Maverick Capital’s largest holding.
SUMMARY and Coupang, Inc. Tearsheet
As Maverick Capital, Ltd.’s largest individual stock holding, we’re highlighting Coupang, Inc. (CPNG:USA) tearsheet today.
As the Uniform Accounting tearsheet for Coupang highlights, its Uniform P/E trades at -43.8x, which is below the global corporate average of 20.6x, but above its historical average of -102.0x.
Low P/Es require low EPS growth to sustain them. That said, in the case of Coupang, the company has recently shown 96% Uniform EPS shrinkage.
Wall Street analysts provide stock and valuation recommendations that, in general, provide very poor guidance or insight. However, Wall Street analysts’ near-term earnings forecasts tend to have relevant information.
We take Wall Street forecasts for GAAP earnings and convert them to Uniform earnings forecasts. When we do this, Coupang’s Wall Street analyst-driven forecast is for EPS to decline by 38% and 75% in 2022 and 2023, respectively.
Meanwhile, the company’s earning power is -45%, below the long-run corporate averages. However, cash flows and cash on hand are nearly 2x the total obligations—including debt maturities and capex maintenance. This signals a low operating risk.
Lastly, Coupang’s Uniform earnings growth is below peer averages and is trading below peer valuations.
Best regards,
Joel Litman & Rob Spivey
Chief Investment Strategist &
Director of Research
at Valens Research
This portfolio analysis highlights the same insights we use to power our FA Alpha product. To find out more visit our website.