Activist campaigns in the investment industry have seen a rise last year due to losses in the stock market and a decline in profitability for some companies.
In the world of activist investing, Elliott Management is surely one of the leading players.
The fund was founded by Paul Singer in 1977 and has closed a total of 133 activist campaigns, 66% of which have been successful or settled.
Additionally, its activism campaigns are not targeting small to mid-sized companies, the fund has made a name for itself by going after well-known global corporations like AT&T (T), Softbank (TSE:9984), and Paypal (PYPL).
The fund has been highly active, especially in the last three years, and it has closed 35 activist campaigns since the beginning of 2020.
Elliott has made the headlines again recently as it is targeting the largest CRM company in the world, Salesforce (CRM), and a 144-year-old Japanese conglomerate.
As Elliott acquired a multi-billion dollar stake in the CRM company, the fund placed 3 new directors on the company’s board.
This may sound like bad news for Salesforce’s management team but considering Elliott’s track record in boosting shareholder value with its campaigns, doesn’t sound bad at all for its investors.
As such, Salesforce stock performed positively after the announcement, it rose around 5% in almost a week.
In light of this, let’s have a look at the fund using Uniform Accounting and see if it is well-positioned for its activism strategies to work.
Economic productivity is massively misunderstood on Wall Street. This is reflected by the 130+ distortions in the Generally Accepted Accounting Principles (GAAP) that make as-reported results poor representations of real economic productivity.
These distortions include the poor capitalization of R&D, the use of goodwill and intangibles to inflate a company’s asset base, a poor understanding of one-off expense line items, as well as flawed acquisition accounting.
It’s no surprise that once many of these distortions are accounted for, it becomes apparent which companies are in real robust profitability and which may not be as strong of an investment.
See for yourself below.
Founded by Cliff Asness and friends in 1988, AQR is one of the largest hedge funds in the world.
Since its inception, the fund has been focused on quantitative strategies like algorithms and computerized models to trade stocks, bonds, currencies, and commodities.
That makes sense because the name AQR stands for “Applied Quantitative Research”.
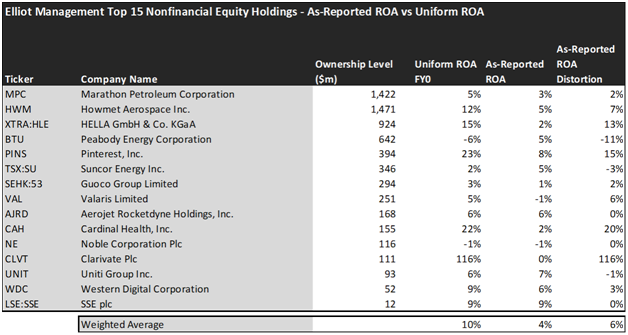
Looking at as-reported accounting numbers, investors would think that investing in Elliott Management would result in returns lower than the cost of capital.
On an as-reported basis, many of the companies in the fund are poor performers. The average as-reported ROA for the top 15 holdings of the fund is 4%.
However, once we make Uniform Accounting adjustments to accurately calculate the earning power, we can see that the average return in Elliott Management’s top 15 holdings is actually 10%.
As the distortions from as-reported accounting are removed, we can see that Cardinal Health (CAH) isn’t a 2% return business. Its Uniform ROA is 22%.
Meanwhile, the British-American information services and analytics company Clarivate (CLVT) looks like an unprofitable business with 0% ROA, but it actually powers an impressive 116% Uniform ROA.
To find companies that can deliver alpha beyond the market, just finding companies where as-reported metrics misrepresent a company’s real profitability is insufficient.
To really generate alpha, any investor also needs to identify where the market is significantly undervaluing the company’s potential.
These dislocations demonstrate that most of these firms are in a different financial position than GAAP may make their books appear. But there is another crucial step in the search for alpha. Investors need to also find companies that are performing better than their valuations imply.
Valens has built a systematic process called Embedded Expectations Analysis to help investors get a sense of the future performance already baked into a company’s current stock price. Take a look:
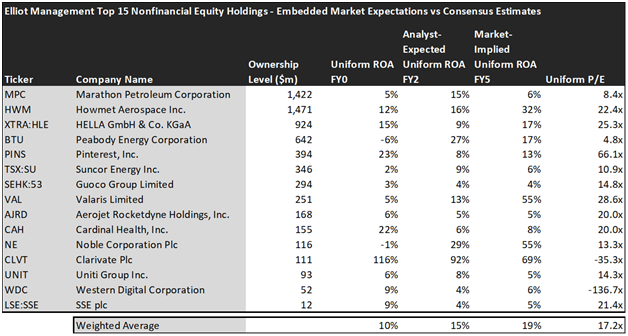
This chart shows four interesting data points:
- The average Uniform ROA among Elliott Management’s top 15 holdings is actually 10% which is slightly worse than the corporate average in the United States.
- The analyst-expected Uniform ROA represents what ROA is forecasted to do over the next two years. To get the ROA value, we take consensus Wall Street estimates and convert them to the Uniform Accounting framework.
- The market-implied Uniform ROA is what the market thinks Uniform ROA is going to be in the three years following the analyst expectations, which for most companies here are 2023, 2024, and 2025. Here, we show the sort of economic productivity a company needs to achieve to justify its current stock price.
- The Uniform P/E is our measure of how expensive a company is relative to its Uniform earnings. For reference, the average Uniform P/E across the investing universe is roughly 20x.
Embedded Expectations Analysis of Elliott Management paints a clear picture. Over the next few years, Wall Street analysts expect the companies in the fund to improve in profitability. The market agrees with analysts’ expectations but it’s more optimistic.
Analysts forecast the portfolio holdings on average to see Uniform ROA rise to 15% over the next two years. At current valuations, the market agrees with the analysts and expects a 19% Uniform ROA for the companies in the portfolio.
For instance, Howmet Aerospace (HWM) returned 12% this year. Analysts think its returns will increase to 16%. And at a 22.4x Uniform P/E, the market expects a further improvement in profitability and is pricing Uniform ROA to be around 32%.
Similarly, the largest offshore drilling and well drilling company in the world, Valaris (VAL), has a Uniform ROA of 5%. Analysts expect its returns will increase to 13% and the market is pricing its returns to rise to 55%.
Overall, Elliott Management has high-quality companies in its portfolio that could deliver strong returns and has names in line with its active investing strategies. However, the market’s profitability expectations are much above what the companies in its portfolio are currently generating. This situation may lead to some downside risk for investors that want to invest in Elliott Management since the market is already pricing in a possible improvement in these companies’ profitability. That is why investors should carefully analyze current valuations and consider market expectations before any investment decisions are made.
This just goes to show the importance of valuation in the investing process. Finding a company with strong profitability and growth is only half of the process. The other, just as important part, is attaching reasonable valuations to the companies and understanding which have upside which has not been fully priced into their current prices.
To see a list of companies that have great performance and stability also at attractive valuations, the Valens Conviction Long Idea List is the place to look. The conviction list is powered by the Valens database, which offers access to full Uniform Accounting metrics for thousands of companies.
Click here to get access.
Read on to see a detailed tearsheet of one of Elliott Management’s largest holdings.
SUMMARY and Marathon Petroleum Corporation Tearsheet
As one of Elliott Management’s largest individual stock holdings, we’re highlighting Marathon Petroleum Corporation’s (MPC:USA) tearsheet today.
As the Uniform Accounting tearsheet for Marathon Petroleum Corporation highlights, its Uniform P/E trades at 8.4x, which is below the global corporate average of 18.4x, and around its historical average of 166.7x.
Low P/Es require low EPS growth to sustain them. That said, in the case of Marathon Petroleum Corporation, the company has recently shown 195% Uniform EPS shrinkage.
Wall Street analysts provide stock and valuation recommendations that, in general, provide very poor guidance or insight. However, Wall Street analysts’ near-term earnings forecasts tend to have relevant information.
We take Wall Street forecasts for GAAP earnings and convert them to Uniform earnings forecasts. When we do this, Marathon Petroleum Corporation’s Wall Street analyst-driven forecast is for EPS to grow by 1,714% in 2022 and shrink by 46% in 2023.
Furthermore, the company’s return on assets was 5% in 2021, which is below the long-run corporate averages. Also, cash flows and cash on hand consistently exceed its total obligations—including debt maturities and CAPEX maintenance. Moreover, its intrinsic credit risk is 80bps above the risk-free rate. Together, these signal low dividend risks and low credit risks.
Lastly, Marathon Petroleum Corporation’s Uniform earnings growth is above peer averages, and below peer valuations.
Best regards,
Joel Litman & Rob Spivey
Chief Investment Strategist &
Director of Research
at Valens Research
This portfolio analysis highlights the same insights we share with our FA Alpha Members. To find out more, visit our website.